Pca
Download as PPTX, PDF5 likes2,717 views
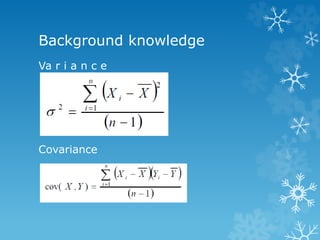
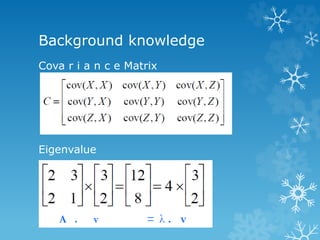
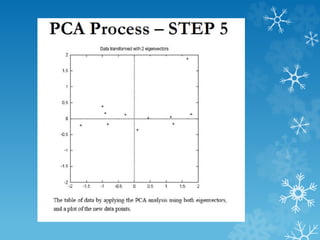
PCA (Principal Component Analysis) is a technique used to simplify complex data sets by reducing their dimensionality. It transforms a number of possibly correlated variables into a smaller number of uncorrelated variables called principal components. The first principal component accounts for as much of the variability in the data as possible, and each succeeding component accounts for as much of the remaining variability as possible. The document provides background on concepts like variance, covariance, and eigenvalues that are important to understanding PCA. It also includes an example of using PCA to analyze student data and identify the most important parameters to describe students.
1 of 26
Downloaded 266 times





Recommended
Lect5 principal component analysis


Lect5 principal component analysishktripathy
Ěý
This document describes the 5 steps of principal component analysis (PCA):
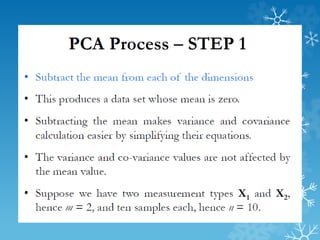
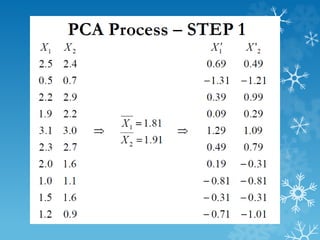
1) Subtract the mean from each dimension of the data to center it around zero.
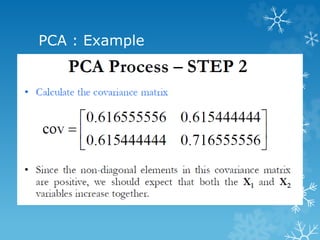
2) Calculate the covariance matrix of the data.
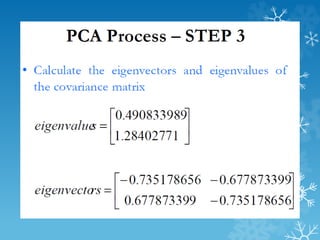
3) Calculate the eigenvalues and eigenvectors of the covariance matrix.
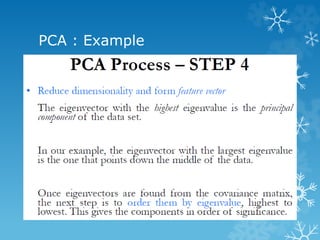
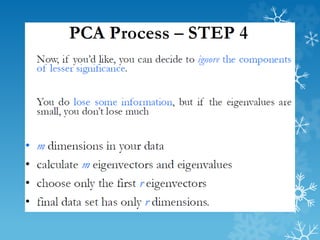
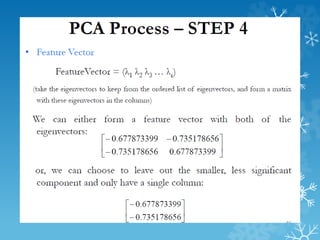
4) Form a feature vector by selecting eigenvectors corresponding to largest eigenvalues. Project the data onto this to reduce dimensions.
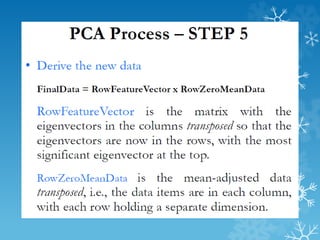
5) To reconstruct the data, take the transpose of the feature vector and multiply it with the projected data, then add the mean back.PCA


PCAmathurnidhi
Ěý
Principal Component Analysis (PCA) is a technique used to simplify complex data sets by identifying patterns in the data and expressing it in such a way to highlight similarities and differences. It works by subtracting the mean from the data, calculating the covariance matrix, and determining the eigenvectors and eigenvalues to form a feature vector representing the data in a lower dimensional space. PCA can be used to represent image data as a one dimensional vector by stacking the pixel rows of an image and applying this analysis to multiple images.Principal component analysis


Principal component analysisPartha Sarathi Kar
Ěý
Principal component analysis (PCA) is a technique used to simplify complex datasets. It works by converting a set of observations of possibly correlated variables into a set of linearly uncorrelated variables called principal components. PCA identifies patterns in data and expresses the data in such a way as to highlight their similarities and differences. The main implementations of PCA are eigenvalue decomposition and singular value decomposition. PCA is useful for data compression, reducing dimensionality for visualization and building predictive models. However, it works best for data that follows a multidimensional normal distribution.Introduction to principal component analysis (pca)


Introduction to principal component analysis (pca)Mohammed Musah
Ěý
This document provides an introduction to principal component analysis (PCA), outlining its purpose for data reduction and structural detection. It defines PCA as a linear combination of weighted observed variables. The procedure section discusses assumptions like normality, homoscedasticity, and linearity that are evaluated prior to PCA. Requirements for performing PCA include the variables being at the metric or nominal level, sufficient sample size and variable ratios, and adequate correlations between variables.Pca(principal components analysis)


Pca(principal components analysis)kalung0313
Ěý
PCA projects data onto principal components to reduce dimensionality while retaining most information. It works by (1) zero-centering the data, (2) calculating the covariance matrix to measure joint variability, (3) computing eigenvalues and eigenvectors of the covariance matrix to identify principal components with most variation, and (4) mapping the zero-centered data to a new space using the eigenvectors. This transforms the data onto a new set of orthogonal axes oriented in the directions of maximum variance.Principal Component Analysis


Principal Component AnalysisRicardo Wendell Rodrigues da Silveira
Ěý
şÝşÝߣs used to present an overview on Principal Component Analysis during a analytics group meeting at TWBR.Introduction to Principle Component Analysis


Introduction to Principle Component AnalysisSunjeet Jena
Ěý
This presentation provides a introductory understanding of Principle Component Analysis and how it can be used for data clustering and visualization.Principal component analysis and lda


Principal component analysis and ldaSuresh Pokharel
Ěý
PCA and LDA are dimensionality reduction techniques. PCA transforms variables into uncorrelated principal components while maximizing variance. It is unsupervised. LDA finds axes that maximize separation between classes while minimizing within-class variance. It is supervised and finds axes that separate classes well. The document provides mathematical explanations of how PCA and LDA work including calculating covariance matrices, eigenvalues, eigenvectors, and transformations.Lect4 principal component analysis-I


Lect4 principal component analysis-Ihktripathy
Ěý
Principal Component Analysis (PCA) is a technique used to reduce the dimensionality of data by transforming it to a new coordinate system. It works by finding the principal components - linear combinations of variables with the highest variance - and using those to project the data to a lower dimensional space. PCA is useful for visualizing high-dimensional data, reducing dimensions without much loss of information, and finding patterns. It involves calculating the covariance matrix and solving the eigenvalue problem to determine the principal components.Pca analysis


Pca analysisCollege of Fisheries, KVAFSU, Mangalore, Karnataka
Ěý
PCA is a technique used to simplify complex datasets by transforming correlated variables into a set of uncorrelated variables called principal components. It identifies patterns in high-dimensional data and expresses the data in a way that highlights similarities and differences. PCA is useful for analyzing data and reducing dimensionality without much loss of information. It works by rotating the existing axes to capture major variability in the data while ignoring smaller variations.Pca ppt


Pca pptDheeraj Dwivedi
Ěý
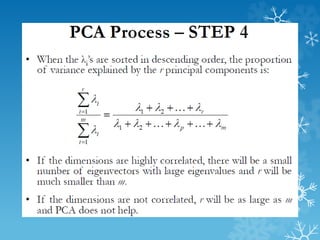
PCA transforms correlated variables into uncorrelated variables called principal components. It finds the directions of maximum variance in high-dimensional data by computing the eigenvectors of the covariance matrix. The first principal component accounts for as much of the variability in the data as possible, and each succeeding component accounts for as much of the remaining variability as possible. Dimensionality reduction is achieved by ignoring components with small eigenvalues, retaining only the most significant components.Principal Component Analysis (PCA) and LDA PPT şÝşÝߣs


Principal Component Analysis (PCA) and LDA PPT şÝşÝߣsAbhishekKumar4995
Ěý
Machine learning (ML) technique use for Dimension reduction, feature extraction and analyzing huge amount of data are Principal Component Analysis (PCA) and Linear Discriminant Analysis (LDA) are easily and interactively explained with scatter plot graph , 2D and 3D projection of Principal components(PCs) for better understanding. Principal component analysis


Principal component analysisFarah M. Altufaili
Ěý
This document discusses principal component analysis (PCA) and its applications in image processing and facial recognition. PCA is a technique used to reduce the dimensionality of data while retaining as much information as possible. It works by transforming a set of correlated variables into a set of linearly uncorrelated variables called principal components. The first principal component accounts for as much of the variability in the data as possible, and each succeeding component accounts for as much of the remaining variability as possible. The document provides an example of applying PCA to a set of facial images to reduce them to their principal components for analysis and recognition.Data Reduction


Data ReductionRajan Shah
Ěý
This document discusses various data reduction techniques including dimensionality reduction through attribute subset selection, numerosity reduction using parametric and non-parametric methods like data cube aggregation, and data compression. It describes how attribute subset selection works to find a minimum set of relevant attributes to make patterns easier to detect. Methods for attribute subset selection include forward selection, backward elimination, and bi-directional selection. Decision trees can also help identify relevant attributes. Data cube aggregation stores multidimensional summarized data to provide fast access to precomputed information.PCA (Principal component analysis)


PCA (Principal component analysis)Learnbay Datascience
Ěý
Principal Component Analysis, or PCA, is a factual method that permits you to sum up the data contained in enormous information tables by methods for a littler arrangement of "synopsis files" that can be all the more handily envisioned and broke down.Dimensionality Reduction


Dimensionality Reductionmrizwan969
Ěý
This document discusses dimensionality reduction techniques for data mining. It begins with an introduction to dimensionality reduction and reasons for using it. These include dealing with high-dimensional data issues like the curse of dimensionality. It then covers major dimensionality reduction techniques of feature selection and feature extraction. Feature selection techniques discussed include search strategies, feature ranking, and evaluation measures. Feature extraction maps data to a lower-dimensional space. The document outlines applications of dimensionality reduction like text mining and gene expression analysis. It concludes with trends in the field.Exploratory data analysis v1.0


Exploratory data analysis v1.0Vishy Chandra
Ěý
Exploratory data analysis is an approach consisting of tools that help you understand your data easily. These tools can be used with minimal knowledge of statistics.
EDA tools are presented here by The School of Continuous Improvement with the main purpose of anyone wanting to use these tools to be able to use them.Implement principal component analysis (PCA) in python from scratch


Implement principal component analysis (PCA) in python from scratchEshanAgarwal4
Ěý
In this presentation we are understanding what is PCA and how to implement it in python from scratch.Principal Component Analysis PCA


Principal Component Analysis PCAAbdullah al Mamun
Ěý
Principal Component Analysis(PCA) technique was introduced by the mathematician Karl Pearson in 1901. It works on the condition that while the data in a higher dimensional space is mapped to data in a lower dimension space, the variance of the data in the lower dimensional space should be maximum.
Principal Component Analysis (PCA) is a statistical procedure that uses an orthogonal transformation that converts a set of correlated variables to a set of uncorrelated variables.PCA is the most widely used tool in exploratory data analysis and in machine learning for predictive models. Moreover,
Principal Component Analysis (PCA) is an unsupervised learning algorithm technique used to examine the interrelations among a set of variables. It is also known as a general factor analysis where regression determines a line of best fit.
The main goal of Principal Component Analysis (PCA) is to reduce the dimensionality of a dataset while preserving the most important patterns or relationships between the variables without any prior knowledge of the target variables.
Principal Component Analysis (PCA) is used to reduce the dimensionality of a data set by finding a new set of variables, smaller than the original set of variables, retaining most of the sample’s information, and useful for the regression and classification of data.Chapter 10. Cluster Analysis Basic Concepts and Methods.ppt


Chapter 10. Cluster Analysis Basic Concepts and Methods.pptSubrata Kumer Paul
Ěý
Jiawei Han, Micheline Kamber and Jian Pei
Data Mining: Concepts and Techniques, 3rd ed.
The Morgan Kaufmann Series in Data Management Systems
Morgan Kaufmann Publishers, July 2011. ISBN 978-0123814791Data Science - Part XII - Ridge Regression, LASSO, and Elastic Nets


Data Science - Part XII - Ridge Regression, LASSO, and Elastic NetsDerek Kane
Ěý
The document discusses various regression techniques including ridge regression, lasso regression, and elastic net regression. It begins with an overview of advancements in regression analysis since the late 1800s/early 1900s enabled by increased computing power. Modern high-dimensional data often has many independent variables, requiring improved regression methods. The document then provides technical explanations and formulas for ordinary least squares regression, ridge regression, lasso regression, and their properties such as bias-variance tradeoffs. It explains how ridge and lasso regression address limitations of OLS through regularization that shrinks coefficients.Dimension Reduction: What? Why? and How?


Dimension Reduction: What? Why? and How?Kazi Toufiq Wadud
Ěý
Process of converting data set having vast dimensions into data set with lesser dimensions ensuring that it conveys similar information concisely.
Concept
R codeData Mining: clustering and analysis


Data Mining: clustering and analysisDataminingTools Inc
Ěý
Clustering is the process of grouping similar objects together. It allows data to be analyzed and summarized. There are several methods of clustering including partitioning, hierarchical, density-based, grid-based, and model-based. Hierarchical clustering methods are either agglomerative (bottom-up) or divisive (top-down). Density-based methods like DBSCAN and OPTICS identify clusters based on density. Grid-based methods impose grids on data to find dense regions. Model-based clustering uses models like expectation-maximization. High-dimensional data can be clustered using subspace or dimension-reduction methods. Constraint-based clustering allows users to specify preferences.CART – Classification & Regression Trees


CART – Classification & Regression TreesHemant Chetwani
Ěý
This document discusses Classification and Regression Trees (CART), a data mining technique for classification and regression. CART builds decision trees by recursively splitting data into purer child nodes based on a split criterion, with the goal of minimizing heterogeneity. It describes the 8 step CART generation process: 1) testing all possible splits of variables, 2) evaluating splits using reduction in impurity, 3) selecting the best split, 4) repeating for all variables, 5) selecting the split with most reduction in impurity, 6) assigning classes, 7) repeating on child nodes, and 8) pruning trees to avoid overfitting.Support Vector Machines (SVM)


Support Vector Machines (SVM)FAO
Ěý
FAO - Global Soil Partnership training on Digital Soil Organic Carbon Mapping by Mr. Yusuf Yigini, 20 - 24 January 2018, Tehran, Iran. (Day 5, 3) Support vector machines (svm)


Support vector machines (svm)Sharayu Patil
Ěý
A Support Vector Machine (SVM) is a discriminative classifier formally defined by a separating hyperplane. In other words, given labeled training data (supervised learning), the algorithm outputs an optimal hyperplane which categorizes new examples. In two dimentional space this hyperplane is a line dividing a plane in two parts where in each class lay in either side.The Method Of Maximum Likelihood


The Method Of Maximum LikelihoodMax Chipulu
Ěý
The document introduces the maximum likelihood method (MLM) for determining the most likely cause of an observed result from several possible causes. It provides examples of using MLM to determine the most likely father of a child from potential candidates and the most likely distribution of balls in a box based on the observed colors of balls drawn from the box. MLM involves calculating the likelihood of each potential cause producing the observed result and selecting the cause with the highest likelihood as the most probable explanation.Anomaly detection Workshop slides


Anomaly detection Workshop slidesQuantUniversity
Ěý
Anomaly detection (or Outlier analysis) is the identification of items, events or observations which do not conform to an expected pattern or other items in a dataset. It is used is applications such as intrusion detection, fraud detection, fault detection and monitoring processes in various domains including energy, healthcare and finance.
In this workshop, we will discuss the core techniques in anomaly detection and discuss advances in Deep Learning in this field.
Through case studies, we will discuss how anomaly detection techniques could be applied to various business problems. We will also demonstrate examples using R, Python, Keras and Tensorflow applications to help reinforce concepts in anomaly detection and best practices in analyzing and reviewing results.
What you will learn:
Anomaly Detection: An introduction
Graphical and Exploratory analysis techniques
Statistical techniques in Anomaly Detection
Machine learning methods for Outlier analysis
Evaluating performance in Anomaly detection techniques
Detecting anomalies in time series data
Case study 1: Anomalies in Freddie Mac mortgage data
Case study 2: Auto-encoder based Anomaly Detection for Credit risk with Keras and Tensorflowpca.pdf


pca.pdfAnshumanDwivedi14
Ěý
This document discusses principal component analysis (PCA) in machine learning. It defines PCA as a dimensionality reduction technique that transforms correlated variables into uncorrelated principal components sorted by variance. The document outlines the curse of dimensionality in high-dimensional data and lists PCA, factor analysis, linear discriminant analysis, and truncated SVD as methods to reduce dimensionality. It then describes the six steps of the PCA algorithm and how PCA identifies the principal components that account for the most variation in the data to reduce dimensionality while reconstructing the data.. An introduction to machine learning and probabilistic ...


. An introduction to machine learning and probabilistic ...butest
Ěý
This document provides an overview and introduction to machine learning and probabilistic graphical models. It discusses key topics such as supervised learning, unsupervised learning, graphical models, inference, and structure learning. The document covers techniques like decision trees, neural networks, clustering, dimensionality reduction, Bayesian networks, and learning the structure of probabilistic graphical models.More Related Content
What's hot (20)
Lect4 principal component analysis-I


Lect4 principal component analysis-Ihktripathy
Ěý
Principal Component Analysis (PCA) is a technique used to reduce the dimensionality of data by transforming it to a new coordinate system. It works by finding the principal components - linear combinations of variables with the highest variance - and using those to project the data to a lower dimensional space. PCA is useful for visualizing high-dimensional data, reducing dimensions without much loss of information, and finding patterns. It involves calculating the covariance matrix and solving the eigenvalue problem to determine the principal components.Pca analysis


Pca analysisCollege of Fisheries, KVAFSU, Mangalore, Karnataka
Ěý
PCA is a technique used to simplify complex datasets by transforming correlated variables into a set of uncorrelated variables called principal components. It identifies patterns in high-dimensional data and expresses the data in a way that highlights similarities and differences. PCA is useful for analyzing data and reducing dimensionality without much loss of information. It works by rotating the existing axes to capture major variability in the data while ignoring smaller variations.Pca ppt


Pca pptDheeraj Dwivedi
Ěý
PCA transforms correlated variables into uncorrelated variables called principal components. It finds the directions of maximum variance in high-dimensional data by computing the eigenvectors of the covariance matrix. The first principal component accounts for as much of the variability in the data as possible, and each succeeding component accounts for as much of the remaining variability as possible. Dimensionality reduction is achieved by ignoring components with small eigenvalues, retaining only the most significant components.Principal Component Analysis (PCA) and LDA PPT şÝşÝߣs


Principal Component Analysis (PCA) and LDA PPT şÝşÝߣsAbhishekKumar4995
Ěý
Machine learning (ML) technique use for Dimension reduction, feature extraction and analyzing huge amount of data are Principal Component Analysis (PCA) and Linear Discriminant Analysis (LDA) are easily and interactively explained with scatter plot graph , 2D and 3D projection of Principal components(PCs) for better understanding. Principal component analysis


Principal component analysisFarah M. Altufaili
Ěý
This document discusses principal component analysis (PCA) and its applications in image processing and facial recognition. PCA is a technique used to reduce the dimensionality of data while retaining as much information as possible. It works by transforming a set of correlated variables into a set of linearly uncorrelated variables called principal components. The first principal component accounts for as much of the variability in the data as possible, and each succeeding component accounts for as much of the remaining variability as possible. The document provides an example of applying PCA to a set of facial images to reduce them to their principal components for analysis and recognition.Data Reduction


Data ReductionRajan Shah
Ěý
This document discusses various data reduction techniques including dimensionality reduction through attribute subset selection, numerosity reduction using parametric and non-parametric methods like data cube aggregation, and data compression. It describes how attribute subset selection works to find a minimum set of relevant attributes to make patterns easier to detect. Methods for attribute subset selection include forward selection, backward elimination, and bi-directional selection. Decision trees can also help identify relevant attributes. Data cube aggregation stores multidimensional summarized data to provide fast access to precomputed information.PCA (Principal component analysis)


PCA (Principal component analysis)Learnbay Datascience
Ěý
Principal Component Analysis, or PCA, is a factual method that permits you to sum up the data contained in enormous information tables by methods for a littler arrangement of "synopsis files" that can be all the more handily envisioned and broke down.Dimensionality Reduction


Dimensionality Reductionmrizwan969
Ěý
This document discusses dimensionality reduction techniques for data mining. It begins with an introduction to dimensionality reduction and reasons for using it. These include dealing with high-dimensional data issues like the curse of dimensionality. It then covers major dimensionality reduction techniques of feature selection and feature extraction. Feature selection techniques discussed include search strategies, feature ranking, and evaluation measures. Feature extraction maps data to a lower-dimensional space. The document outlines applications of dimensionality reduction like text mining and gene expression analysis. It concludes with trends in the field.Exploratory data analysis v1.0


Exploratory data analysis v1.0Vishy Chandra
Ěý
Exploratory data analysis is an approach consisting of tools that help you understand your data easily. These tools can be used with minimal knowledge of statistics.
EDA tools are presented here by The School of Continuous Improvement with the main purpose of anyone wanting to use these tools to be able to use them.Implement principal component analysis (PCA) in python from scratch


Implement principal component analysis (PCA) in python from scratchEshanAgarwal4
Ěý
In this presentation we are understanding what is PCA and how to implement it in python from scratch.Principal Component Analysis PCA


Principal Component Analysis PCAAbdullah al Mamun
Ěý
Principal Component Analysis(PCA) technique was introduced by the mathematician Karl Pearson in 1901. It works on the condition that while the data in a higher dimensional space is mapped to data in a lower dimension space, the variance of the data in the lower dimensional space should be maximum.
Principal Component Analysis (PCA) is a statistical procedure that uses an orthogonal transformation that converts a set of correlated variables to a set of uncorrelated variables.PCA is the most widely used tool in exploratory data analysis and in machine learning for predictive models. Moreover,
Principal Component Analysis (PCA) is an unsupervised learning algorithm technique used to examine the interrelations among a set of variables. It is also known as a general factor analysis where regression determines a line of best fit.
The main goal of Principal Component Analysis (PCA) is to reduce the dimensionality of a dataset while preserving the most important patterns or relationships between the variables without any prior knowledge of the target variables.
Principal Component Analysis (PCA) is used to reduce the dimensionality of a data set by finding a new set of variables, smaller than the original set of variables, retaining most of the sample’s information, and useful for the regression and classification of data.Chapter 10. Cluster Analysis Basic Concepts and Methods.ppt


Chapter 10. Cluster Analysis Basic Concepts and Methods.pptSubrata Kumer Paul
Ěý
Jiawei Han, Micheline Kamber and Jian Pei
Data Mining: Concepts and Techniques, 3rd ed.
The Morgan Kaufmann Series in Data Management Systems
Morgan Kaufmann Publishers, July 2011. ISBN 978-0123814791Data Science - Part XII - Ridge Regression, LASSO, and Elastic Nets


Data Science - Part XII - Ridge Regression, LASSO, and Elastic NetsDerek Kane
Ěý
The document discusses various regression techniques including ridge regression, lasso regression, and elastic net regression. It begins with an overview of advancements in regression analysis since the late 1800s/early 1900s enabled by increased computing power. Modern high-dimensional data often has many independent variables, requiring improved regression methods. The document then provides technical explanations and formulas for ordinary least squares regression, ridge regression, lasso regression, and their properties such as bias-variance tradeoffs. It explains how ridge and lasso regression address limitations of OLS through regularization that shrinks coefficients.Dimension Reduction: What? Why? and How?


Dimension Reduction: What? Why? and How?Kazi Toufiq Wadud
Ěý
Process of converting data set having vast dimensions into data set with lesser dimensions ensuring that it conveys similar information concisely.
Concept
R codeData Mining: clustering and analysis


Data Mining: clustering and analysisDataminingTools Inc
Ěý
Clustering is the process of grouping similar objects together. It allows data to be analyzed and summarized. There are several methods of clustering including partitioning, hierarchical, density-based, grid-based, and model-based. Hierarchical clustering methods are either agglomerative (bottom-up) or divisive (top-down). Density-based methods like DBSCAN and OPTICS identify clusters based on density. Grid-based methods impose grids on data to find dense regions. Model-based clustering uses models like expectation-maximization. High-dimensional data can be clustered using subspace or dimension-reduction methods. Constraint-based clustering allows users to specify preferences.CART – Classification & Regression Trees


CART – Classification & Regression TreesHemant Chetwani
Ěý
This document discusses Classification and Regression Trees (CART), a data mining technique for classification and regression. CART builds decision trees by recursively splitting data into purer child nodes based on a split criterion, with the goal of minimizing heterogeneity. It describes the 8 step CART generation process: 1) testing all possible splits of variables, 2) evaluating splits using reduction in impurity, 3) selecting the best split, 4) repeating for all variables, 5) selecting the split with most reduction in impurity, 6) assigning classes, 7) repeating on child nodes, and 8) pruning trees to avoid overfitting.Support Vector Machines (SVM)


Support Vector Machines (SVM)FAO
Ěý
FAO - Global Soil Partnership training on Digital Soil Organic Carbon Mapping by Mr. Yusuf Yigini, 20 - 24 January 2018, Tehran, Iran. (Day 5, 3) Support vector machines (svm)


Support vector machines (svm)Sharayu Patil
Ěý
A Support Vector Machine (SVM) is a discriminative classifier formally defined by a separating hyperplane. In other words, given labeled training data (supervised learning), the algorithm outputs an optimal hyperplane which categorizes new examples. In two dimentional space this hyperplane is a line dividing a plane in two parts where in each class lay in either side.The Method Of Maximum Likelihood


The Method Of Maximum LikelihoodMax Chipulu
Ěý
The document introduces the maximum likelihood method (MLM) for determining the most likely cause of an observed result from several possible causes. It provides examples of using MLM to determine the most likely father of a child from potential candidates and the most likely distribution of balls in a box based on the observed colors of balls drawn from the box. MLM involves calculating the likelihood of each potential cause producing the observed result and selecting the cause with the highest likelihood as the most probable explanation.Anomaly detection Workshop slides


Anomaly detection Workshop slidesQuantUniversity
Ěý
Anomaly detection (or Outlier analysis) is the identification of items, events or observations which do not conform to an expected pattern or other items in a dataset. It is used is applications such as intrusion detection, fraud detection, fault detection and monitoring processes in various domains including energy, healthcare and finance.
In this workshop, we will discuss the core techniques in anomaly detection and discuss advances in Deep Learning in this field.
Through case studies, we will discuss how anomaly detection techniques could be applied to various business problems. We will also demonstrate examples using R, Python, Keras and Tensorflow applications to help reinforce concepts in anomaly detection and best practices in analyzing and reviewing results.
What you will learn:
Anomaly Detection: An introduction
Graphical and Exploratory analysis techniques
Statistical techniques in Anomaly Detection
Machine learning methods for Outlier analysis
Evaluating performance in Anomaly detection techniques
Detecting anomalies in time series data
Case study 1: Anomalies in Freddie Mac mortgage data
Case study 2: Auto-encoder based Anomaly Detection for Credit risk with Keras and TensorflowSimilar to Pca (20)
pca.pdf


pca.pdfAnshumanDwivedi14
Ěý
This document discusses principal component analysis (PCA) in machine learning. It defines PCA as a dimensionality reduction technique that transforms correlated variables into uncorrelated principal components sorted by variance. The document outlines the curse of dimensionality in high-dimensional data and lists PCA, factor analysis, linear discriminant analysis, and truncated SVD as methods to reduce dimensionality. It then describes the six steps of the PCA algorithm and how PCA identifies the principal components that account for the most variation in the data to reduce dimensionality while reconstructing the data.. An introduction to machine learning and probabilistic ...


. An introduction to machine learning and probabilistic ...butest
Ěý
This document provides an overview and introduction to machine learning and probabilistic graphical models. It discusses key topics such as supervised learning, unsupervised learning, graphical models, inference, and structure learning. The document covers techniques like decision trees, neural networks, clustering, dimensionality reduction, Bayesian networks, and learning the structure of probabilistic graphical models.Machine Learning and Real-World Applications


Machine Learning and Real-World ApplicationsMachinePulse
Ěý
This presentation was created by Ajay, Machine Learning Scientist at MachinePulse, to present at a Meetup on Jan. 30, 2015. These slides provide an overview of widely used machine learning algorithms. The slides conclude with examples of real world applications.
Ajay Ramaseshan, is a Machine Learning Scientist at MachinePulse. He holds a Bachelors degree in Computer Science from NITK, Suratkhal and a Master in Machine Learning and Data Mining from Aalto University School of Science, Finland. He has extensive experience in the machine learning domain and has dealt with various real world problems.Machine learning


Machine learningSukhwinder Singh
Ěý
This document provides an overview of machine learning techniques using R. It discusses regression, classification, linear models, decision trees, neural networks, genetic algorithms, support vector machines, and ensembling methods. Evaluation metrics and algorithms like lm(), rpart(), nnet(), ksvm(), and ga() are presented for different machine learning tasks. The document also compares inductive learning, analytical learning, and explanation-based learning approaches.Singular Value Decomposition (SVD).pptx


Singular Value Decomposition (SVD).pptxrajalakshmi5921
Ěý
1. Singular Value Decomposition (SVD) is a matrix factorization technique that decomposes a matrix into three other matrices.
2. SVD is primarily used for dimensionality reduction, information extraction, and noise reduction.
3. Key applications of SVD include matrix approximation, principal component analysis, image compression, recommendation systems, and signal processing.EDAB Module 5 Singular Value Decomposition (SVD).pptx


EDAB Module 5 Singular Value Decomposition (SVD).pptxrajalakshmi5921
Ěý
1. Singular Value Decomposition (SVD) is a matrix factorization technique that decomposes a matrix into three other matrices.
2. SVD is primarily used for dimensionality reduction, information extraction, and noise reduction.
3. Key applications of SVD include matrix approximation, principal component analysis, image compression, recommendation systems, and signal processing.Understanding the Machine Learning Algorithms


Understanding the Machine Learning AlgorithmsRupak Roy
Ěý
includes distinguishable definitions from supervised vs unsupervised learning with their types and the workflow, algorithm map;
Let me know if anything is required. Happy to help, Talk soon! #bobrupakroyMS Thesis


MS ThesisJatin Agarwal
Ěý
This document describes research on efficient data structures and algorithms for solving range aggregate problems. It begins with introductions to computational geometry and classic problems in the field like finding the closest pair of points. It then discusses concepts like output sensitivity and different computation models. Range searching data structures like range trees are described for solving problems like orthogonal range queries. The document outlines solving problems related to planar range maxima and planar range convex hull queries. It proposes preprocessing point data to speed up queries for problems like reporting the skyline points within a 2-sided range.MS Thesis


MS ThesisJatin Agarwal
Ěý
This document describes research on efficient data structures and algorithms for solving range aggregate problems. It begins with introductions to computational geometry and classic problems in the field like finding the closest pair of points. It then discusses concepts like output sensitivity and different computation models. Range searching data structures like range trees are described for solving problems like orthogonal range queries. The document outlines solving problems related to planar range maxima and planar range convex hull queries. It proposes preprocessing point data to speed up queries for problems like reporting the skyline points within a 2-sided range.Linear Regression


Linear RegressionEng Teong Cheah
Ěý
Linear regression is a simple and popular approach to solving regression problems that assumes the output is a linear combination of input features. It uses a dataset of samples indexed by i, with each input data point xi and corresponding label yi, to find the linear relationship that minimizes a loss function typically via gradient descent. While linear regression is a single-layer neural network, more complex deep networks can learn nonlinear relationships from data. Data Science and Machine Learning with Tensorflow


Data Science and Machine Learning with TensorflowShubham Sharma
Ěý
Importance of Machine Learning and AI – Emerging applications, end-use
Pictures (Amazon recommendations, Driverless Cars)
Relationship betweeen Data Science and AI .
Overall structure and components
What tools can be used – technologies, packages
List of tools and their classification
List of frameworks
Artificial Intelligence and Neural Networks
Basics Of ML,AI,Neural Networks with implementations
Machine Learning Depth : Regression Models
Linear Regression : Math Behind
Non Linear Regression : Math Behind
Machine Learning Depth : Classification Models
Decision Trees : Math Behind
Deep Learning
Mathematics Behind Neural Networks
Terminologies
What are the opportunities for data analytics professionals
NLP - Sentiment Analysis


NLP - Sentiment AnalysisRupak Roy
Ěý
Process the sentiments of NLP with Naive Bayes Rule, Random Forest, Support Vector Machine, and much more.
Thanks, for your time, if you enjoyed this short slide there are tons of topics in advanced analytics, data science, and machine learning available in my medium repo. https://medium.com/@bobrupakroyFr pca lda


Fr pca ldaultraraj
Ěý
The document discusses principal component analysis (PCA) and linear discriminant analysis (LDA) for dimensionality reduction in pattern recognition and their application to face recognition. PCA finds the directions along which the data varies the most to reduce dimensionality while retaining variation. LDA seeks directions that maximize between-class variation and minimize within-class variation. Studies show LDA performs better than PCA for classification when the training set is large and representative of each class.ML Lab.docx


ML Lab.docxCentral university of Haryana
Ěý
The document provides an introduction to principal component analysis (PCA) for dimensionality reduction, explaining that PCA projects data into a lower-dimensional subspace while retaining most of the information; it describes the steps of PCA which include calculating the covariance matrix, performing eigendecomposition to obtain eigenvalues and eigenvectors, and projecting the data onto the principal components to obtain the lower-dimensional representation; additionally, it notes that PCA can be performed using scikit-learn's PCA class for reusable dimensionality reduction of new data.Neural Networks: Principal Component Analysis (PCA)


Neural Networks: Principal Component Analysis (PCA)Mostafa G. M. Mostafa
Ěý
PCA is an unsupervised learning technique used to reduce the dimensionality of large data sets by transforming the data to a new set of variables called principal components. The first principal component accounts for as much of the variability in the data as possible, and each succeeding component accounts for as much of the remaining variability as possible. PCA is commonly used for applications like dimensionality reduction, data compression, and visualization. The document discusses PCA algorithms and applications of PCA in domains like face recognition, image compression, and noise filtering.Introduction to data visualization tools like Tableau and Power BI and Excel


Introduction to data visualization tools like Tableau and Power BI and ExcelLipika Sharma
Ěý
Overview of Data Science Tools and Technologies Practical --1.pdf


Practical --1.pdfCentral university of Haryana
Ěý
This document provides an introduction to principal component analysis (PCA) for feature extraction. It describes PCA as a method to project high-dimensional data into a lower-dimensional subspace while retaining the most important information. The key steps are outlined as calculating the mean of each column, centering the data, computing the covariance matrix, performing eigendecomposition of the covariance matrix to obtain eigenvalues and eigenvectors, and projecting the data onto the new subspace defined by the principal components with the highest eigenvalues. Implementing PCA using scikit-learn's PCA class is also briefly discussed.Comparison on PCA ICA and LDA in Face Recognition


Comparison on PCA ICA and LDA in Face Recognitionijdmtaiir
Ěý
Face recognition is used in wide range of application.
In recent years, face recognition has become one of the most
successful applications in image analysis and understanding.
Different statistical method and research groups reported a
contradictory result when comparing principal component
analysis (PCA) algorithm, independent component analysis
(ICA) algorithm, and linear discriminant analysis (LDA)
algorithm that has been proposed in recent years. The goal of
this paper is to compare and analyze the three algorithms and
conclude which is best. Feret Dataset is used for consistencyDownload


Downloadbutest
Ěý
The document discusses several collaborative filtering techniques for making recommendations, including k-nearest neighbors (kNN), naive Bayes classification, singular value decomposition (SVD), and probabilistic models. It provides examples of how these methods work, such as using ratings from similar users to predict a user's rating for an item (kNN), and decomposing a ratings matrix to capture relationships between users and items (SVD). The techniques vary in their assumptions, complexity, and ability to incorporate additional user/item metadata. Evaluation on new data is important to ensure the methods generalize well beyond the training data.Download


Downloadbutest
Ěý
The document discusses several collaborative filtering techniques for making recommendations:
1) Nearest neighbor techniques like k-NN make predictions based on the ratings of similar users. They require storing all user data but can be fast with appropriate data structures.
2) Naive Bayes classifiers treat each item's ratings independently; they make strong assumptions but require less data.
3) Dimensionality reduction techniques like SVD decompose the user-item rating matrix to find latent factors. Weighted SVD handles missing data.
4) Probabilistic models like mixtures of multinomials and aspect models represent additional user metadata but have more parameters.Recently uploaded (20)
Practice Head Torpedo - Neometrix Defence.pptx


Practice Head Torpedo - Neometrix Defence.pptxNeometrix_Engineering_Pvt_Ltd
Ěý
About
Practice Head is assembled with Practice Torpedo intended for carrying out exercise firings. It is assembled with Homing Head in the forward section and oxygen flask in the rear section. Practice Head imparts positive buoyancy to the Torpedo at the end of run. The Practice Head is divided into two compartments viz. Ballast Compartment (Houses Light Device, Depth & Roll Recorder, Signal Flare Ejector, Discharge Valve, Stop Cock, Water discharge Valve, Bellow reducing Valve, Release Mechanism, Recess, Bypass Valve, Pressure Equalizer, Float, Sinking Plug etc.) which provides positive buoyancy at the end of run by discharging water (140 ltrs.) filled in the compartment and Instrument compartment (dry), houses (safety & recovery unit and its battery, combined homing and influence exploder equipment, noise maker, bollards & safety valve etc.) The recess in Ballast compartment houses the float which gets inflated at the end of run to provide floatation to the surfaced Torpedo. Several hand holes/recesses are provided on the casing/shell of Practice Head for assembly of the following components:-
a) Signal Flare Ejector Assembly
b) Depth and Roll Recorder Assembly
c) Light Device
d) Pressure equalizer
e) Drain/Discharge Valve assembly
f) Bollard Assembly
g) Holding for Floater/Balloon Assembly
h) Sinking Valve
i) Safety Valve
j) Inspection hand hole
Technical Details:
SrNo Items Specifications
1 Aluminum Alloy (AlMg5)
Casing Body Material: AlMg5
• Larger Outer Diameter of the Casing: 532.4 MM
• Smaller Outer Diameter of the Casing: 503.05 MM
• Total Length: 1204.20 MM
• Thickness: 6-8 mm
• Structural Details of Casing: The casing is of uniform outer dia for a certain distance from rear side and tapered from a definite distance to the front side. (Refer T-DAP-A1828-GADWG-PH- REV 00)
• Slope of the Tapered Portion: 1/8
• Mass of Casing (Without components mounting, but including the ribs and collars on the body): 58.5 kg
• Maximum External Test Pressure: 12 kgf/cm2
• Maximum Internal Test Pressure:-
i. For Ballast Compartment: 2 kgf/cm2
ii. For Instrument Compartment: 1 kgf/cm2
• Innerspace of casing assembly have 2 compartments:-
i. Ballast Compartment and
ii. Instrument Compartment
• Cut outs/ recesses shall be provided for the assembly of following components.
a) Signal Flare Ejector Assembly
b) Depth and Roll Recorder Assembly
c) Light Device
d) Pressure Equalizer
e) Drain/ discharge valve assembly
2 Front Side Collar Material: AlMg5
• Maximum Outer Diameter: 500 MM
• Pitch Circle Diameter: 468 MM
• All Dimensions as per drawing T-DAP-A1828-MDWG-C&R-REV-00
Application:
In a torpedo, the ballast components and instrument compartment play crucial roles in maintaining stability, control, and overall operational effectiveness. The ballast system primarily manages buoyancy and trim, ensuring that the torpedo maintains a stable trajectory underwater.Turbocor Product and Technology Review.pdf


Turbocor Product and Technology Review.pdfTotok Sulistiyanto
Ěý
High Efficiency Chiller System in HVACESIT135 Problem Solving Using Python Notes of Unit-3


ESIT135 Problem Solving Using Python Notes of Unit-3prasadmutkule1
Ěý
ESIT135 Problem Solving Using Python Notes of Unit-3 Environmental Product Declaration - Uni Bell


Environmental Product Declaration - Uni BellManishPatel169454
Ěý
The Uni-Bell PVC Pipe Association (PVCPA) has published the first North American industry-wide environmental product declaration (EPD) for water and sewer piping, and it has been verified by NSF Sustainability, a division of global public health organization NSF International.AO Star Algorithm in Artificial Intellligence


AO Star Algorithm in Artificial Intellligencevipulkondekar
Ěý
AO Star Algorithm in Artificial IntellligenceESIT135 Problem Solving Using Python Notes of Unit-1 and Unit-2


ESIT135 Problem Solving Using Python Notes of Unit-1 and Unit-2prasadmutkule1
Ěý
ESIT135 Problem Solving Using Python Notes of Unit-1 and Unit-2A Star Algorithm in Artificial intelligence


A Star Algorithm in Artificial intelligencevipulkondekar
Ěý
A Star Algorithm in Artificial intelligenceWireless-Charger presentation for seminar .pdf


Wireless-Charger presentation for seminar .pdfAbhinandanMishra30
Ěý
Wireless technology used in chargerAI-Powered Power Converter Design Workflow.pdf


AI-Powered Power Converter Design Workflow.pdfAleksandr Terlo
Ěý
Blending human expertise with AI-driven optimization for efficient power converter design.AIR FILTER system in internal combustion engine system.ppt


AIR FILTER system in internal combustion engine system.pptthisisparthipan1
Ěý
air filter system in ic engine Soil Properties and Methods of Determination


Soil Properties and Methods of DeterminationRajani Vyawahare
Ěý
This PPT covers the index and engineering properties of soil. It includes details on index properties, along with their methods of determination. Various important terms related to soil behavior are explained in detail. The presentation also outlines the experimental procedures for determining soil properties such as water content, specific gravity, plastic limit, and liquid limit, along with the necessary calculations and graph plotting. Additionally, it provides insights to understand the importance of these properties in geotechnical engineering applications.Von karman Equation full derivation .pdf


Von karman Equation full derivation .pdfEr. Gurmeet Singh
Ěý
Von karman Equation full derivation
By Er. GURMEET SINGH
G.C.E.T JAMMU
Contact: gurmeet.b.tech@gmail.com
M.tech Transportation Engineering Common Network Architecture:X.25 Networks, Ethernet (Standard and Fast): fram...


Common Network Architecture:X.25 Networks, Ethernet (Standard and Fast): fram...SnehPrasad2
Ěý
X.25 Networks, Ethernet (Standard and Fast): frame format and specifications, Wireless LAN’s – 802.11x, 802.3 Bluetooth etc.
IoT-based-Electrical-Motor-Fault-Detection-System.pptx


IoT-based-Electrical-Motor-Fault-Detection-System.pptxatharvapardeshi03
Ěý
IoT-based-Electrical-Motor-Fault-Detection-System.pptxPca
- 1. PCA : Principal Component Analysis Author : Nalini Yadav Under Guidance of Prof. K. Rajeshwari
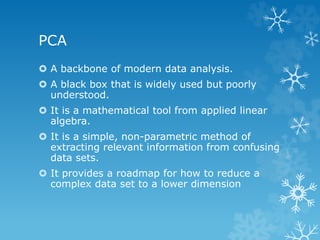
- 2. PCA ď‚› A backbone of modern data analysis. ď‚› A black box that is widely used but poorly understood. ď‚› It is a mathematical tool from applied linear algebra. ď‚› It is a simple, non-parametric method of extracting relevant information from confusing data sets. ď‚› It provides a roadmap for how to reduce a complex data set to a lower dimension
- 3. Background knowledge Va r i a n c e Covariance
- 4. Background knowledge Cova r i a n c e Matrix Eigenvalue
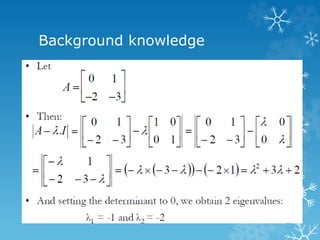
- 5. Background knowledge  Finding the roots of | A – λ .I| will give the eigenvalues and for each of these eigenvalues there will be an eigenvector
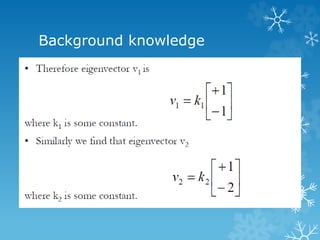
- 7. Background knowledge ď‚› Therefore the first eigenvector is any column vector in which the two elements have equal magnitude and opposite sign.
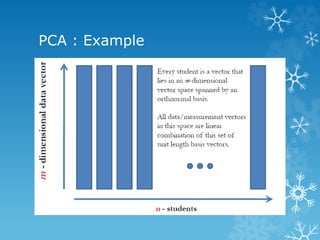
- 9. PCA : Example We collected m parameters about 100 students Height Weight Hair color Average grade … We want to find the most important parameters that best describe a student.
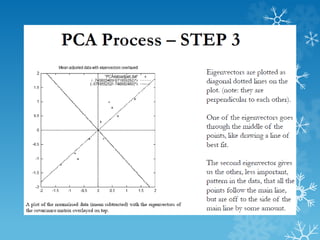
- 10. PCA : Example
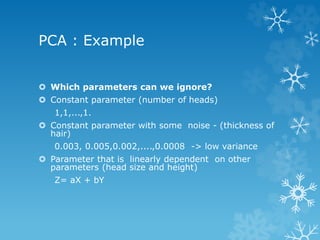
- 11. PCA : Example ď‚› Which parameters can we ignore? ď‚› Constant parameter (number of heads) 1,1,...,1. ď‚› Constant parameter with some noise - (thickness of hair) 0.003, 0.005,0.002,....,0.0008 -> low variance ď‚› Parameter that is linearly dependent on other parameters (head size and height) Z= aX + bY
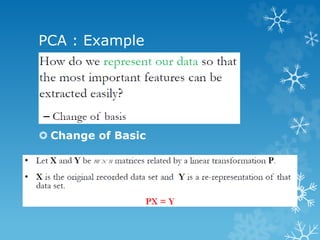
- 12. PCA : Example ď‚› Change of Basic
- 13. PCA : Example
- 14. PCA : Example
- 15. PCA : Example
- 16. PCA : Example
- 17. PCA : Example
- 18. PCA : Example
- 19. PCA : Example
- 20. PCA : Example
- 21. PCA : Example
- 22. PCA : Example
- 23. PCA : Example
- 24. PCA : Example
- 25. PCA : Example
- 26. Thank You


