PEDv Panel
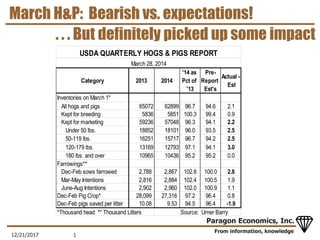
- 1. From information, knowledge Paragon Economics, Inc. March H&P: Bearish vs. expectations! 12/21/2017 1 Inventories on March 1* All hogs and pigs 65072 62899 96.7 94.6 2.1 Kept for breeding 5836 5851 100.3 99.4 0.9 Kept for marketing 59236 57048 96.3 94.1 2.2 Under 50 lbs. 18852 18101 96.0 93.5 2.5 50-119 lbs. 16251 15717 96.7 94.2 2.5 120-179 lbs. 13169 12793 97.1 94.1 3.0 180 lbs. and over 10965 10436 95.2 95.2 0.0 Farrowings** Dec-Feb sows farrowed 2,788 2,867 102.8 100.0 2.8 Mar-May Intentions 2,816 2,884 102.4 100.5 1.9 June-Aug Intentions 2,902 2,960 102.0 100.9 1.1 Dec-Feb Pig Crop* 28,099 27,316 97.2 96.4 0.8 Dec-Feb pigs saved per litter 10.08 9.53 94.5 96.4 -1.9 *Thousand head ** Thousand Litters Source: Urner Barry Category 2013 2014 '14 as Pct of '13 Pre- Report Est's Actual - Est USDA QUARTERLY HOGS & PIGS REPORT March 28, 2014 . . . But definitely picked up some impact
- 2. From information, knowledge Paragon Economics, Inc. Monthly data ŌĆō BIG drop in litter size but . . . 12/21/2017 2 . . . a slight (curious) improvement for Feb
- 3. From information, knowledge Paragon Economics, Inc. The devil is in the details, though . . . ’é¦ March H&P would put quarterly 2014 slghtr totals down 2.1, 3.4, 4 and 2.9% yr/yr. - IMPLICATION: Higher weights would leave ŌĆś14 production very near 2013 levels ’é¦ March slaughter was down 6.7% while 180+ inventory was down 4.8% - AND SEP-NOV PIG CROP WAS UNCHANGED ’é¦ Dec-Feb pig crops in MN, IA and IL were + 5, +2 and +3% yr/yr IN SPITE OF WIDESPREAD PEDV LOSSES 12/21/2017 3
- 4. From information, knowledge Paragon Economics, Inc. Latest PEDv info ŌĆō thru June 7 ŌĆō shows improvement ’é¦ U.S.: new low of 138 wk. ended 5/7 ’é¦ IL & MN have seen big declines ’é¦ Will IA decline (to just 20!) last?? 12/21/2017 4
- 5. From information, knowledge Paragon Economics, Inc. Used suckling pig cases to distribute . . . 12/21/2017 5 . . . total pig losses over time
- 6. From information, knowledge Paragon Economics, Inc. April data still imply HUGE Jul-Sep cuts . . . ’é¦ Assumes 58% of sows infected ’é¦ 2.7 pigs lost per sow -- conservative ’é¦ Total loss is now near 8 million pigs 12/21/2017 6 PIG LOSS COMPUTATIONS PCT OF PRIOR YR. SLGHTR ADJUSTMENTS Birth Month Monthly Share Small Farm Adjustment Pigs lost, thousands Slaughter Month Slghtr Yr Ago +2.5% Percent Change Cull reduction Sows Non PED productivity TOTAL CHANGE May 4.16% 274.50 Jun 6.51% 492.04 Dec 9705.8 -5.07% 1.00% -1.00% 2.00% -3.07% Jul 3.62% 336.35 Jan 10205.3 -3.30% 1.00% -1.00% 1.90% -1.40% Aug 4.52% 352.62 Feb 8806.0 -4.00% 1.00% -1.00% 1.80% -2.20% Sep 3.62% 306.51 Mar 9549.1 -3.21% 1.00% -1.00% 1.80% -1.41% Oct 7.05% 519.71 Apr 9592.3 -5.42% 1.00% -1.00% 1.70% -3.72% Nov 4.52% 404.16 May 9440.7 -4.28% 1.00% -1.00% 1.50% -2.78% Dec 7.23% 545.21 Jun 8401.1 -6.49% 1.00% -1.00% 1.30% -5.19% Jan 11.75% 90% 884.27 Jul 9304.3 -9.50% 1.00% -1.00% 1.25% -8.25% Feb 19.89% 90% 1489.15 Aug 9794.2 -15.20% 1.00% -1.00% 1.20% -14.00% Mar 16.27% 90% 1372.51 Sep 9249.5 -14.84% 1.00% -1.00% 1.15% -13.69% Apr 10.85% 90% 960.22 Oct 10680.5 -8.99% 1.00% -1.00% 1.10% -7.89%
- 7. From information, knowledge Paragon Economics, Inc. Rabobank makes me look like an OPTIMIST! 12/21/2017 7
- 8. From information, knowledge Paragon Economics, Inc. Actual slaughter declines have been larger 12/21/2017 8 . . . Partially due to delayed mktg/higher wts Slaughter Month Total Slaughter Pct. Chng., yr/yr Barrow/Gilt Slaughter Pct. Chng., yr/yr Dec 9730.1 -2.14% 9397 -2.01% Jan 9791.2 -1.66% 9459 -1.39% Feb 8668.2 0.90% 8366 1.10% Mar 8674.6 -6.89% 8356 -6.92% Apr 8855 -5.38% 8527 -5.32% May 8560 -2.64% CHECK AGAINST ACTUAL SLAUGHTER
- 9. From information, knowledge Paragon Economics, Inc. UM survey of 9 systems ŌĆō 58% of herds pos. 12/21/2017 9
- 10. From information, knowledge Paragon Economics, Inc. Same number of herds in March as Oct ??? 12/21/2017 10 . . . Does that mean Sept will be like April???
- 11. From information, knowledge Paragon Economics, Inc. But consider . . . ’é¦ The 9 named systems had 741,300 sows according to SFŌĆÖs ŌĆś13 Powerhouses - Only Christensen, Seaboard and ISF are among the top 10 ’é¦ The other 7 must have roughly 1.76 mil- lion sows ŌĆō and must all be in the top 10 ’é¦ Geographic locations imply that the UM sample has high proportion in NC and OK ŌĆō and roughly one-third in Midwest 12/21/2017 11
- 12. From information, knowledge Paragon Economics, Inc. If Midwest incidence is the same . . . 12/21/2017 12 Total MW cases National cases with new MW number
- 13. From information, knowledge Paragon Economics, Inc. Weekly forecasts ŌĆō me and USDA . . . 12/21/2017 13 . . . Has been VERY good 5 of past 7 weeks


