Perspectivas (2019)
1 like227 views

This document contains references to various sources related to urban planning, data visualization, and information design. It discusses maps created by Dr. John Snow tracking a cholera outbreak in London in 1854, Charles Minard's map showing Napoleon's 1812 march on Moscow, and emotion maps created by Christian Nold mapping feelings in various cities. It also references works by Tufte, Meirelles, Barr and others on quantitative information display and includes several citations of papers by Dr. Francisco Javier Abarca-Alvarez on topics like urban vulnerability, gentrification detection, and using self-organizing maps for decision support.


Perspectivas (2019)
- 1. URBAN GAMES Perspectivas Departamento de Urbanística y Ordenación del Territorio Universidad de Granada Profesor: Dr. Francisco Javier Abarca-Álvarez fcoabarca@ugr.es
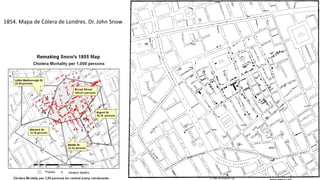
- 3. 1854. Mapa de C├│lera de Londres. Dr. John Snow
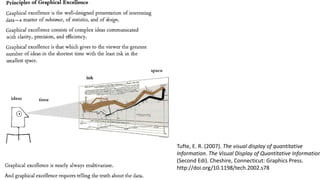
- 7. Tufte, E. R. (2007). The visual display of quantitative Information. The Visual Display of Quantitative Information (Second Edi). Cheshire, Connecticut: Graphics Press. http://doi.org/10.1198/tech.2002.s78
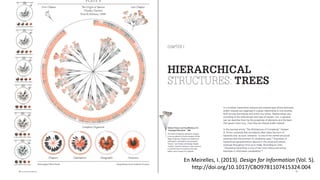
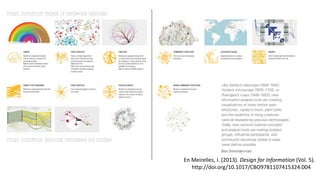
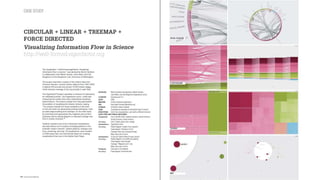
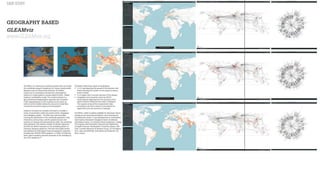
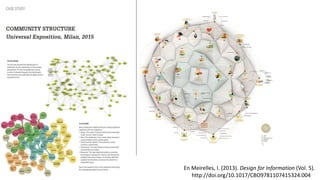
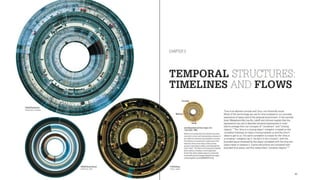
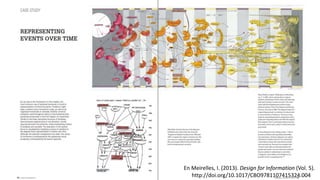
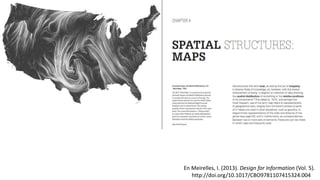
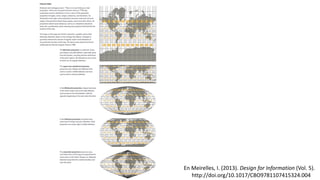
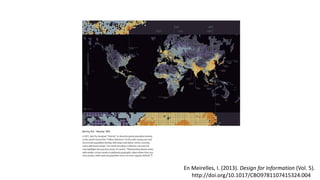
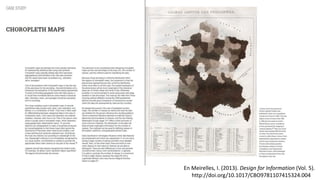
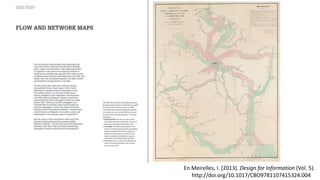
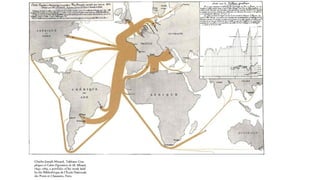
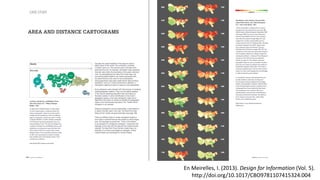
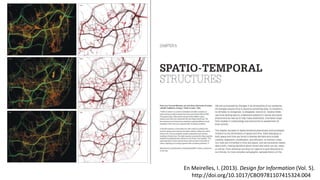
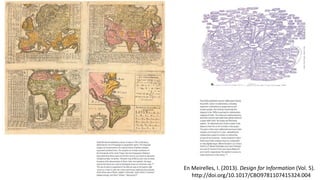
- 8. En Meirelles, I. (2013). Design for Information (Vol. 5). http://doi.org/10.1017/CBO9781107415324.004
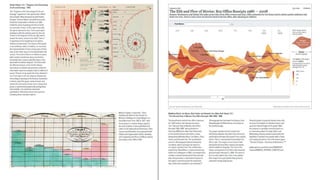
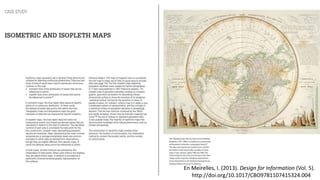
- 12. Joseph Hutchins Colton, JohnsonÔÇÖs New Illustrated Family Atlas with Physical Geography (New York, 1864), pp. 10-11.
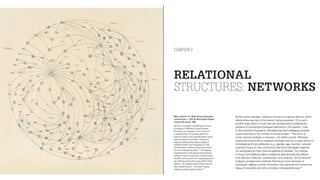
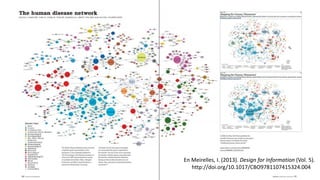
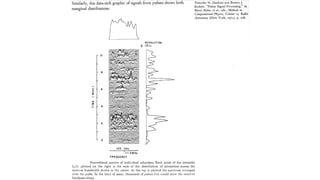
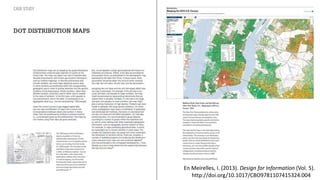
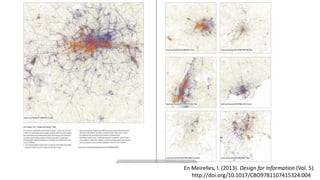
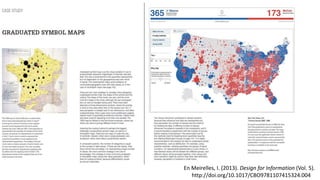
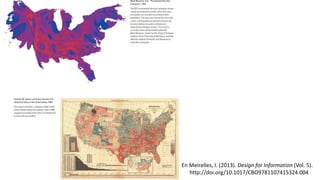
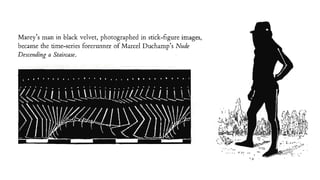
- 13. En Meirelles, I. (2013). Design for Information (Vol. 5). http://doi.org/10.1017/CBO9781107415324.004
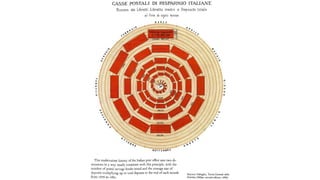
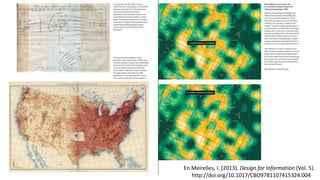
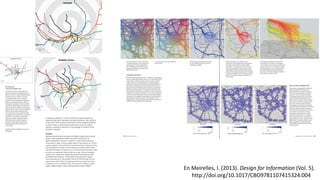
- 14. En Meirelles, I. (2013). Design for Information (Vol. 5). http://doi.org/10.1017/CBO9781107415324.004
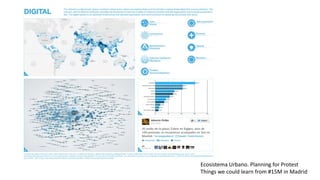
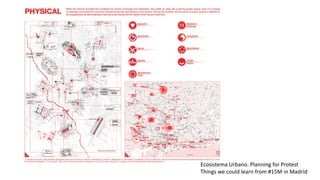
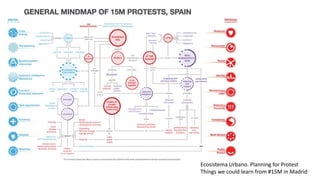
- 15. Ecosistema Urbano. Planning for Protest Things we could learn from #15M in Madrid
- 16. Ecosistema Urbano. Planning for Protest Things we could learn from #15M in Madrid
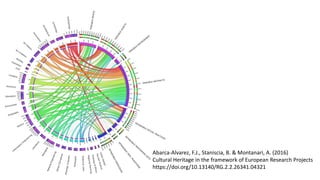
- 18. Abarca-Alvarez, F.J., Staniscia, B. & Montanari, A. (2016) Cultural Heritage in the framework of European Research Projects https://doi.org/10.13140/RG.2.2.26341.04321
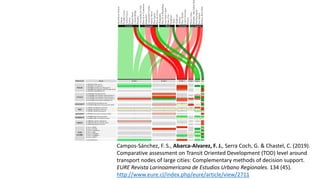
- 21. Campos-Sánchez, F. S., Abarca-Alvarez, F. J., Serra Coch, G. & Chastel, C. (2019). Comparative assessment on Transit Oriented Development (TOD) level around transport nodes of large cities: Complementary methods of decision support. EURE Revista Larinoamericana de Estudios Urbano Regionales. 134 (45). http://www.eure.cl/index.php/eure/article/view/2711
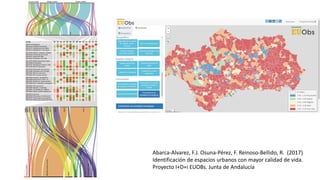
- 22. Abarca-Alvarez, F.J. Osuna-P├®rez, F. Reinoso-Bellido, R. (2017) Identificaci├│n de espacios urbanos con mayor calidad de vida. Proyecto I+D+i EUOBs. Junta de Andaluc├¡a
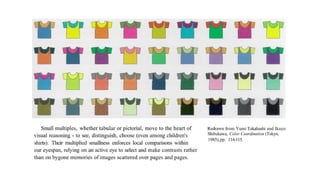
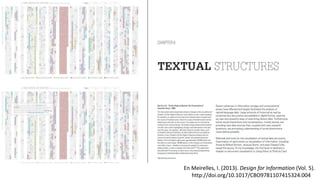
- 24. En Meirelles, I. (2013). Design for Information (Vol. 5). http://doi.org/10.1017/CBO9781107415324.004
- 28. En Meirelles, I. (2013). Design for Information (Vol. 5). http://doi.org/10.1017/CBO9781107415324.004
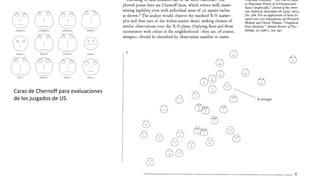
- 31. En Meirelles, I. (2013). Design for Information (Vol. 5). http://doi.org/10.1017/CBO9781107415324.004
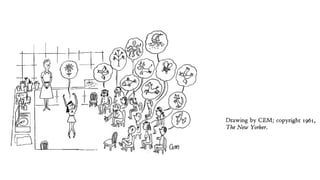
- 32. Caras de Chernoff para evaluaciones de los juzgados de US.
- 33. En Meirelles, I. (2013). Design for Information (Vol. 5). http://doi.org/10.1017/CBO9781107415324.004
- 34. En Meirelles, I. (2013). Design for Information (Vol. 5). http://doi.org/10.1017/CBO9781107415324.004
- 35. En Meirelles, I. (2013). Design for Information (Vol. 5). http://doi.org/10.1017/CBO9781107415324.004
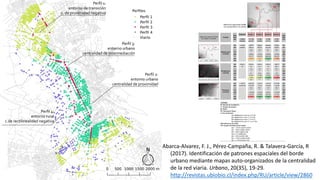
- 36. Abarca-Alvarez, F. J., P├®rez-Campa├▒a, R. & Talavera-Garc├¡a, R (2017). Identificaci├│n de patrones espaciales del borde urbano mediante mapas auto-organizados de la centralidad de la red viaria. Urbano, 20(35), 19-29. http://revistas.ubiobio.cl/index.php/RU/article/view/2860
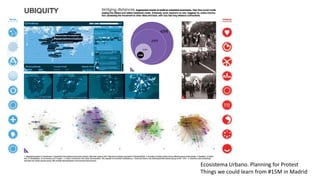
- 37. Ecosistema Urbano. Planning for Protest Things we could learn from #15M in Madrid
- 38. En Meirelles, I. (2013). Design for Information (Vol. 5). http://doi.org/10.1017/CBO9781107415324.004
- 39. En Meirelles, I. (2013). Design for Information (Vol. 5). http://doi.org/10.1017/CBO9781107415324.004
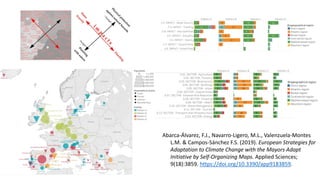
- 40. Abarca-Álvarez, F.J., Navarro-Ligero, M.L., Valenzuela-Montes L.M. & Campos-Sánchez F.S. (2019). European Strategies for Adaptation to Climate Change with the Mayors Adapt Initiative by Self-Organizing Maps. Applied Sciences; 9(18):3859. https://doi.org/10.3390/app9183859.
- 41. En Meirelles, I. (2013). Design for Information (Vol. 5). http://doi.org/10.1017/CBO9781107415324.004
- 42. En Meirelles, I. (2013). Design for Information (Vol. 5). http://doi.org/10.1017/CBO9781107415324.004
- 43. En Meirelles, I. (2013). Design for Information (Vol. 5). http://doi.org/10.1017/CBO9781107415324.004
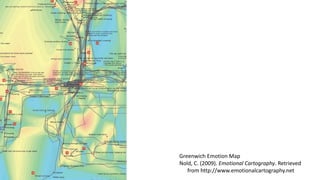
- 44. Greenwich Emotion Map Nold, C. (2009). Emotional Cartography. Retrieved from http://www.emotionalcartography.net
- 45. En Meirelles, I. (2013). Design for Information (Vol. 5). http://doi.org/10.1017/CBO9781107415324.004
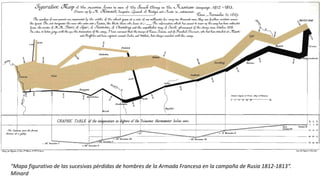
- 47. "Mapa figurativo de las sucesivas p├®rdidas de hombres de la Armada Francesa en la campa├▒a de Rusia 1812-1813ÔÇ£. Minard
- 48. En Meirelles, I. (2013). Design for Information (Vol. 5). http://doi.org/10.1017/CBO9781107415324.004
- 49. En Meirelles, I. (2013). Design for Information (Vol. 5). http://doi.org/10.1017/CBO9781107415324.004
- 50. En Meirelles, I. (2013). Design for Information (Vol. 5). http://doi.org/10.1017/CBO9781107415324.004
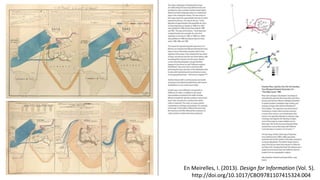
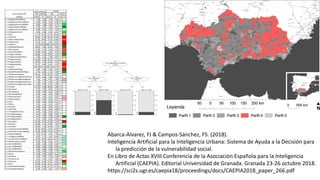
- 51. Abarca-Alvarez, FJ & Campos-Sánchez, FS. (2018). Inteligencia Artificial para la Inteligencia Urbana: Sistema de Ayuda a la Decisión para la predicción de la vulnerabilidad social. En Libro de Actas XVIII Conferencia de la Asociación Española para la Inteligencia Artificial (CAEPIA). Editorial Universidad de Granada. Granada 23-26 octubre 2018. https://sci2s.ugr.es/caepia18/proceedings/docs/CAEPIA2018_paper_266.pdf N de instancias (%) 5381 100.00 Atributo Media DS Media DS conf TE 2.1_EquipSaludPor1000Hab 1.39 6.16 1.56 2.45 ns 2.1_EquipEducacionPor1000Hab 1.14 2.36 2.16 3.20 *** + 2.1_EquipBienestarPor1000Hab 0.83 1.68 1.85 3.77 *** ++ 2.1_EquipCulDepPor1000Hab 0.72 1.47 1.94 3.07 *** +++ 2.1_EquipamientosPor1000Hab 4.08 8.31 7.51 7.25 *** + 2.2_%NoAguaCorriente 0.91 2.84 3.16 6.47 *** ++ 2.2_%Gas 22.77 33.76 12.31 28.29 *** - 2.2_%Telefono 86.96 17.48 63.45 23.69 *** --- 2.5_%PocaLimpiezaCalles 35.10 19.82 21.23 22.00 *** -- 2.6_%Delincuencia 25.32 23.67 4.94 10.62 *** --- 3.1_Poblacion 1367 518.00 900.20 410.50 *** --- 3.1_EdadMediaPoblacion 38.01 4.41 42.74 4.02 *** +++ 3.1_%Nacimientos 11.32 3.21 9.54 2.78 *** -- 3.2_PersonasPorEdificio 14.46 22.91 2.43 3.79 *** -- 3.2_%Hogares1Adulto 18.80 7.55 27.87 7.37 *** +++ 3.2_%Hogares1adultoYMenor 1.83 1.12 1.28 0.92 *** - 3.2_%Hogares2adulto 41.24 6.75 41.01 5.11 ns 3.2_%Hogares3adulto 18.41 3.36 16.53 3.13 *** -- 3.2_%Hogares4adulto 19.71 6.64 13.32 4.70 *** --- 3.2_Hogares 449.20 167.50 340.20 145.70 *** -- 3.2_HabitantesPorHogar 3.04 0.36 2.62 0.31 *** --- 3.2_RatioEdifViviendasPorHogar 0.74 0.56 1.42 0.48 *** +++ 3.3_%PoblacionArraigada 80.11 9.49 82.19 5.00 *** + 3.3_%PoblacionInmigranteProvincial 3.87 5.81 3.83 3.52 ns 3.3_%PoblacionInmigranteRegional 1.35 1.28 0.97 1.09 *** - 3.3_%PoblacionInmigranteNacional 1.58 1.33 1.89 1.59 *** + 3.3_%PoblacionInmigranteExtranjero 1.32 2.79 1.13 1.95 * 3.3_%España 97.92 4.58 98.58 2.68 *** 3.3_%EuropaUE 0.77 2.97 0.82 2.21 ns 3.3_%EuropaNoUE 0.18 0.56 0.12 0.38 *** 3.3_%AmericaDelNorte 0.05 0.18 0.02 0.08 *** 3.3_%AmericaCentral 0.04 0.09 0.01 0.05 *** - 3.3_%AmericaDelSur 0.41 0.83 0.20 0.47 *** - 3.3_%Asia 0.08 0.34 0.02 0.12 *** 3.3_%Africa 0.54 2.01 0.23 1.05 *** 3.3_%Oceania 0.00 0.02 0.00 0.01 *** 3.3_%Apatridas 0.00 0.01 0.00 0.00 *** 3.4_%TrabajaEnProvincia 6.43 5.48 6.81 4.43 * 3.4_%TrabajaEnRegion 0.87 1.00 0.98 0.95 ** 3.4_%TrabajaEnEspaña 0.47 0.57 1.00 1.26 *** +++ 3.4_%TrabajaOtroPais 0.12 0.29 0.16 0.53 ns 4.1_%Ocupados 33.19 6.51 27.38 7.11 *** --- 4.1_%Parados 10.48 5.11 12.95 7.53 *** + 4.1_%Inactivos 38.02 7.24 43.94 7.25 *** +++ 4.2_LocalComercialPor1000Hab 26.90 98.90 19.40 20.90 *** 4.2_OficinaYServiciosPor1000Hab 10.70 44.60 8.10 12.20 *** 4.2_Industrial1000Hab 3.07 12.11 3.63 7.94 ns 4.2_LocalAgrario1000Hab 0.65 6.71 3.14 19.84 ** + 4.2_LocalInactivoPor1000Hab 13.37 20.22 19.63 29.47 *** + 4.3_EstadoConstruccionesD 0.40 0.23 0.50 0.21 *** + 4.4_IDH_COMBINADO- 0.00 0.00 0.00 0.00 *** + 4.4_IDH_COMBINADO+ 0.00 0.00 0.00 0.00 ns 4.4_IDH_COMBINADO 0.00 0.00 0.00 0.00 *** + 4.5_%AgriculturaGanaderia 4.16 6.06 7.28 5.74 *** ++ 4.5_%Pesca 0.14 0.59 0.03 0.12 *** 4.5_%Industria 3.81 2.46 2.81 2.18 *** - 4.5_%Construccion 4.47 2.44 4.35 2.08 ns 4.5_%Servicios 20.61 8.12 12.91 4.83 *** --- 4.5_%Paro 24.09 11.26 31.61 16.40 *** ++ 4.6_%ViviendaEnPropiedad 82.28 13.30 82.73 10.10 ns 4.6_%ViviendasEnAlquiler 9.39 11.29 5.05 5.16 *** - Perfil 4Muestra completa 550 10.22%
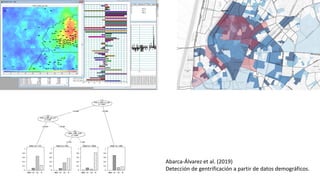
- 52. Abarca-Álvarez et al. (2019) Detección de gentrificación a partir de datos demográficos.
- 53. En Meirelles, I. (2013). Design for Information (Vol. 5). http://doi.org/10.1017/CBO9781107415324.004
- 55. En Meirelles, I. (2013). Design for Information (Vol. 5). http://doi.org/10.1017/CBO9781107415324.004
- 56. En Meirelles, I. (2013). Design for Information (Vol. 5). http://doi.org/10.1017/CBO9781107415324.004
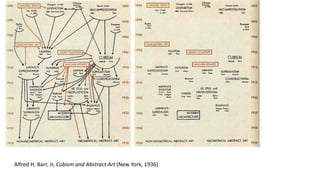
- 57. Alfred H. Barr, Jr, Cubism and Abstract Art (New York, 1936)
- 58. En Meirelles, I. (2013). Design for Information (Vol. 5). http://doi.org/10.1017/CBO9781107415324.004
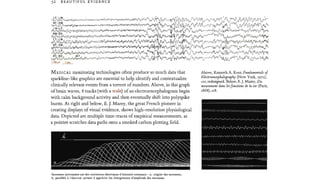
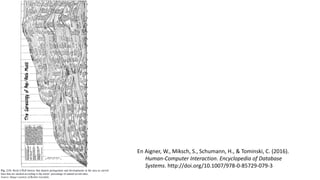
- 59. En Aigner, W., Miksch, S., Schumann, H., & Tominski, C. (2016). Human-Computer Interaction. Encyclopedia of Database Systems. http://doi.org/10.1007/978-0-85729-079-3
- 60. Ecosistema Urbano. Planning for Protest Things we could learn from #15M in Madrid
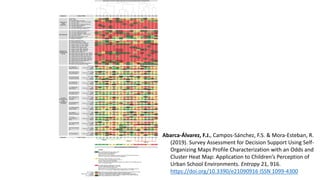
- 61. Abarca-├ülvarez, F.J., Campos-S├ínchez, F.S. & Mora-Esteban, R. (2019). Survey Assessment for Decision Support Using Self- Organizing Maps Profile Characterization with an Odds and Cluster Heat Map: Application to ChildrenÔÇÖs Perception of Urban School Environments. Entropy 21, 916. https://doi.org/10.3390/e21090916 ISSN 1099-4300
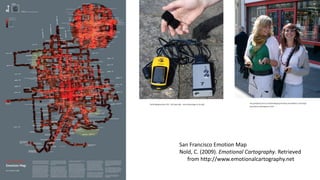
- 62. San Francisco Emotion Map Nold, C. (2009). Emotional Cartography. Retrieved from http://www.emotionalcartography.net
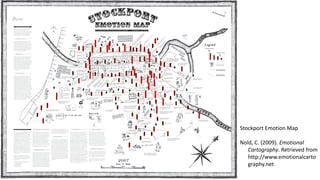
- 63. Stockport Emotion Map Nold, C. (2009). Emotional Cartography. Retrieved from http://www.emotionalcarto graphy.net
- 64. Bibliograf├¡a fundamental Kirk, A. (2012). Data visualization: a successful design process: a structured design approach to equip you with the knowledge of how to successfully accomplish any data visualization challenge efficiently and effectively. Meirelles, I. (2013). Design for Information (Vol. 5). http://doi.org/10.1017/CBO9781107415324.004 Nold, C. (2009). Emotional Cartography. Retrieved from http://www.emotionalcartography.net Tufte, E. R. (1991). Envisioning Information. Bulletin of the Medical Library Association, 79(3), 346ÔÇô348. http://doi.org/10.1213/00000539-199103000-00040 Tufte, E. R. (2006). Beautiful Evidence. Tufte, E. R. (2007). The visual display of quantitative Information. The Visual Display of Quantitative Information (Second Edi). Cheshire, Connecticut: Graphics Press. http://doi.org/10.1198/tech.2002.s78