Phoenix Construction Vital Stats - June
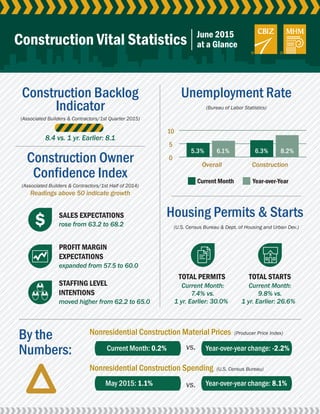
- 1. 0 5 10 Construction Vital Statistics June 2015 at a Glance Unemployment Rate (Bureau of Labor Statistics) 8.2%5.3% Overall Current Month Year-over-Year Construction 6.1% 6.3% Housing Permits & Starts (U.S. Census Bureau & Dept. of Housing and Urban Dev.) TOTAL PERMITS Current Month: 7.4% vs. 1 yr. Earlier: 30.0% TOTAL STARTS Current Month: 9.8% vs. 1 yr. Earlier: 26.6% Nonresidential Construction Material Prices (Producer Price Index) By the Numbers: Current Month: 0.2% Nonresidential Construction Spending (U.S. Census Bureau) Construction Backlog Indicator (Associated Builders & Contractors/1st Quarter 2015) 8.4 vs. 1 yr. Earlier: 8.1 Construction Owner Confidence Index (Associated Builders & Contractors/1st Half of 2014) Readings above 50 indicate growth SALES EXPECTATIONS rose from 63.2 to 68.2 PROFIT MARGIN EXPECTATIONS expanded from 57.5 to 60.0 STAFFING LEVEL INTENTIONS moved higher from 62.2 to 65.0 Year-over-year change: -2.2% May 2015: 1.1% Year-over-year change: 8.1% vs. vs.
- 2. Reading above 50 indicate growth, while readings below 50 are unfavorable. Per the Construction CFOs survey, any index greater than 100 reflects more positives than negatives - less than 100 reflects more negatives than positives Any Architecture Billing Index Score above 50 signifies growth - it is a leading economic indicator that provides an approximately nine to 12 month glimpse into the future of nonresidential construction spending activity. It is a monthly measure of the first (or initial) report for nonresidential building projects in planning, which have been shown to lead construction spending for nonresidential buildings by a full year. Since reaching bottom in July 2011 at a level of 77.1 (2000=100), the index has been trending up. Rates as of mid month. 1 2 3 5 www.cbiz.com/construction1-800-ASK-CBIZ | 4 June 2015 at a Glance Construction Backlog Indicator (Months) Current Backlog Backlog from a year ago (Associated Builders & Contractors) Construction Owner Confidence Index Sales Expectations Profit Margin Expectations Staffing Level Intentions (Associated Builders & Contractors) CONFINDEX Survey Reading Overall Overall current quarter over quarter Overall year over year (Construction Financial Management Association) National Unemployment Rate Overall current month Overall year over year Construction current month Construction year over year (Bureau of Labor Statistics - BLS) National Housing Permits and Starts Permits - Total Permits - Total from twelve months earlier 1 - Family - change from previous month 1 - Family - change year over year 5 + Units - change from previous month 5 + Units - change year over year Starts - Total Starts - Total from twelve months earlier 1 - Family - change from previous month 1 - Family - change year over year 5 + Units - change from previous month 5 + Units - change year over year (U.S. Census Bureau & Dept. of Housing and Urban Dev.) Nonresidential Construction Material Prices Current Month Change year over year (Producer Price Index - PPI) Nonresidential Construction Spending Previous Month Change year over year (U.S. Census Bureau) AIA - Architecture Billing Index Dodge Momentum Index - Commercial Building Interest Rates I-Month LIBOR WSJ Prime Rate 5 Year US Treasury Rate 10 Year US Treasury Rate Feb. ŌĆś15 132 3.2% 5.0% 5.5% 6.7% 10.6% 12.8% 3.0% 7.7% -6.2% 2.8% 19.9% 15.0% -17.0% -3.3% -14.9% 0.7% -21.6% -9.5% 0.4% -4.9% -2.0% 4.8% 50.4 138.5 0.1721% 3.25% 1.41% 1.93% Mar. ŌĆś15 5.5% 6.6% 9.5% 11.3% -5.7% 2.9% 2.1% 4.1% -16.0% 1.6% 2.0% -2.5% 4.4% -2.7% -7.1% -4.7% 0.8% -3.6% -0.1% 4.6% 51.7 134.2 0.1756% 3.25% 1.31% 1.87% Apr. ŌĆś15 5.4% 6.2% 7.5% 9.4% 10.1% 6.4% 3.7% 7.1% 20.0% 4.5% 20.2% 9.2% 16.7% 14.7% 31.9% -0.5% -0.1% -5.1% -0.1% 4.7% 48.8 133.2 0.1807% 3.25% 1.38% 2.13% May ŌĆś15 8.4 8.1 5.5% 6.3% 6.7% 8.6% 11.8% 25.4% 2.6% 9.1% 26.0% 53.9% -11.1% 5.1% -5.4% 6.8% -18.5% 2.6% 1.1% -3.0% 3.2% 8.8% 51.9 129.5 0.1842% 3.25% 1.71% 2.36% Jun. ŌĆś15 137 3.8% 5.4% 5.3% 6.1% 6.3% 8.2% 7.4% 30.0% 0.9% 6.0% 16.1% 79.0% 9.8% 26.6% 0.9% 14.7% 28.6% 55.0% 0.2% -2.2% 1.1% 8.1% 55.7 126.1 0.1859% 3.25% 1.63% 2.36% 1 2 3 5 Jan. ŌĆś15 8.7 8.3 68.2 60.0 65.0 5.7% 6.6% 9.8% 12.3% -0.7% 8.1% -3.1% 5.8% 3.3% 13.8% -2.0% 18.7% -6.7% 16.3% 12.1% 24.5% -2.1% -4.6% 0.4% 5.9% 49.9 133.6 0.1682% 3.25% 1.48% 2.00% 1st 1/2 ŌĆś14 4th Qtr. ŌĆś14 4th Qtr. ŌĆś14 1st Qtr. ŌĆś15 1st Qtr. ŌĆś15 4 Arizona Unemployment Rate 6.6% 7.1% 6.5% 6.7% 7.1% 6.2% 6.5% 7.1% 6.0% 5.9% 6.3% 6.3% 7.1% 6.9% 2.2% 16.3% 5.6% 13.6% -18.2% 10.1% -9.1% 10.4% -4.3% 9.9% -2.0% 13.2% -19.3% -2.0% -2.7% 5.8% 3.0% 3.4% 6.0% 22.5% 39.0% 14.9% 22.2% 13.5% California Unemployment Rate Nevada Unemployment Rate West Housing Permits and Starts 5.8% 6.4% 7.0% 7.0% Overall current month Overall current month Overall current month Permits - Total Permits - Total from twelve months earlier 1 - Family - change from previous month 1 - Family - change year over year Starts - Total Starts - Total from twelve months earlier 1 - Family - change from previous month 1 - Family - change year over year 16.8% -6.7% 26.4% -2.8% -3.7% 21.7% -3.0% 5.3% -1.9% 14.9% 2.6% 20.3% -12.5% 32.5% -9.2% 24.6% 9.5% 27.4% -3.7% 6.2% -6.0% 9.6% -7.1% 12.1%


