Pittcon 2002
- 1. Environmentally Robust Carbon Monoxide Sensor for Fire Detection Dr. Neils R.S. Hansen & Dr. Ann M. Harvey Objective ˇ° To develop a quality CO sensor made via a robust automated manufacturing process.ˇ±
- 2. Portable Gas Detection Flammable Gas Detection Toxic Gas Detection (Semiconductor) BRAND NAMES Residential Gas Detection Sensor Supplier
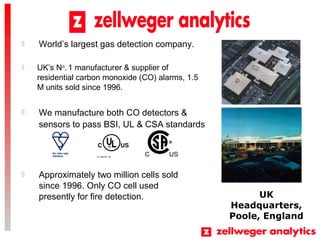
- 3. ? UKˇŻs No . 1 manufacturer & supplier of residential carbon monoxide (CO) alarms, 1.5 M units sold since 1996. UK Headquarters, Poole, England ? We manufacture both CO detectors & sensors to pass BSI, UL & CSA standards ? Approximately two million cells sold since 1996. Only CO cell used presently for fire detection. ? WorldˇŻs largest gas detection company.
- 4. DESIGN STRATEGY Critical analysis of existing products and processes Improve performance to meet more stringent certification approvals introduced since 1996 Design for automation
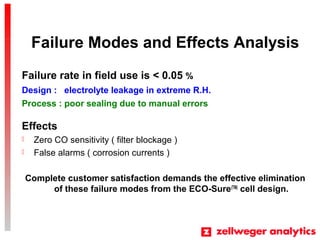
- 5. Failure Modes and Effects Analysis Failure rate in field use is < 0.05 % Process : poor sealing due to manual errors Effects ? Zero CO sensitivity ( filter blockage ) ? False alarms ( corrosion currents ) Complete customer satisfaction demands the effective elimination of these failure modes from the ECO-Sure(TM) cell design. Design : electrolyte leakage in extreme R.H.
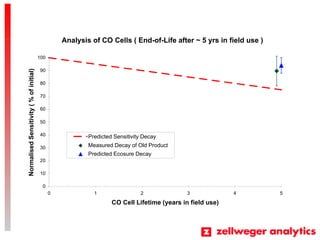
- 6. Analysis of CO Cells ( End-of-Life after ~ 5 yrs in field use ) 0 10 20 30 40 50 60 70 80 90 100 0 1 2 3 4 5 CO Cell Lifetime (years in field use) NormalisedSensitivity(%ofinitial) Predicted Sensitivity Decay Measured Decay of Old Product Predicted Ecosure Decay
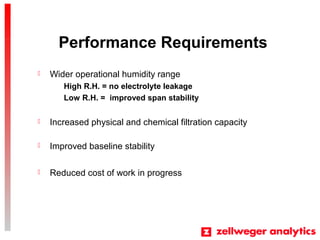
- 7. Performance Requirements ? Improved baseline stability ? Wider operational humidity range High R.H. = no electrolyte leakage Low R.H. = improved span stability ? Increased physical and chemical filtration capacity ? Reduced cost of work in progress
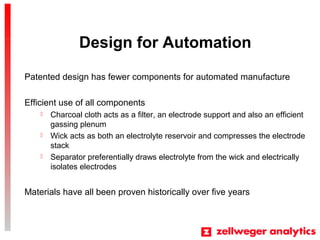
- 8. Design for Automation Patented design has fewer components for automated manufacture Efficient use of all components ? Charcoal cloth acts as a filter, an electrode support and also an efficient gassing plenum ? Wick acts as both an electrolyte reservoir and compresses the electrode stack ? Separator preferentially draws electrolyte from the wick and electrically isolates electrodes Materials have all been proven historically over five years
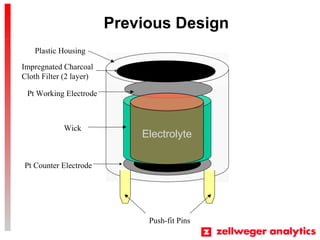
- 9. Previous Design Pt Working Electrode Plastic Housing Impregnated Charcoal Cloth Filter (2 layer) Wick Pt Counter Electrode Push-fit Pins Electrolyte
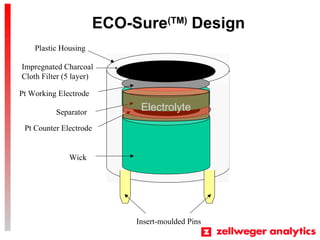
- 10. ECO-Sure(TM) Design Plastic Housing Impregnated Charcoal Cloth Filter (5 layer) Pt Working Electrode Wick Pt Counter Electrode Insert-moulded Pins Separator Electrolyte
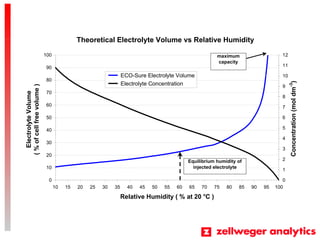
- 11. Theoretical Electrolyte Volume vs Relative Humidity 0 10 20 30 40 50 60 70 80 90 100 10 15 20 25 30 35 40 45 50 55 60 65 70 75 80 85 90 95 100 Relative Humidity ( % at 20 o C ) ElectrolyteVolume (%ofcellfreevolume) 0 1 2 3 4 5 6 7 8 9 10 11 12 Concentration(moldm-3 ) ECO-Sure Electrolyte Volume Electrolyte Concentration maximum capacity Equilibrium humidity of injected electrolyte
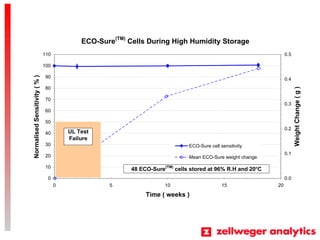
- 12. ECO-Sure(TM) Cells During High Humidity Storage 0 10 20 30 40 50 60 70 80 90 100 110 0 5 10 15 20 Time ( weeks ) NormalisedSensitivity(%) 0.0 0.1 0.2 0.3 0.4 0.5 WeightChange(g) ECO-Sure cell sensitivity Mean ECO-Sure weight change 48 ECO-Sure(TM) cells stored at 96% R.H and 20o C UL Test Failure
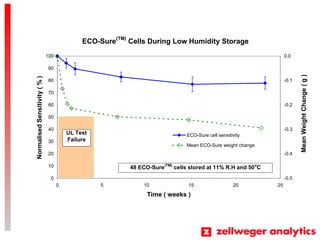
- 13. ECO-Sure(TM) Cells During Low Humidity Storage 0 10 20 30 40 50 60 70 80 90 100 0 5 10 15 20 25 Time ( weeks ) NormalisedSensitivity(%) -0.5 -0.4 -0.3 -0.2 -0.1 0.0 MeanWeightChange(g) ECO-Sure cell sensitivity Mean ECO-Sure weight change 48 ECO-Sure(TM) cells stored at 11% R.H and 50o C UL Test Failure
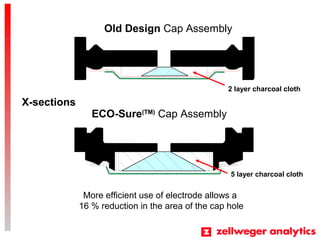
- 14. More efficient use of electrode allows a 16 % reduction in the area of the cap hole ECO-Sure(TM) Cap Assembly Old Design Cap Assembly 2 layer charcoal cloth 5 layer charcoal cloth X-sections
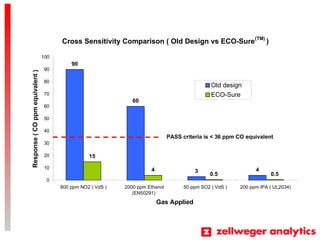
- 15. Cross Sensitivity Comparison ( Old Design vs ECO-Sure(TM) ) 90 60 4 15 4 0.5 0.5 3 0 10 20 30 40 50 60 70 80 90 100 800 ppm NO2 ( VdS ) 2000 ppm Ethanol (EN50291) 50 ppm SO2 ( VdS ) 200 ppm IPA ( UL2034) Gas Applied Response(COppmequivalent) Old design ECO-Sure PASS criteria is < 36 ppm CO equivalent
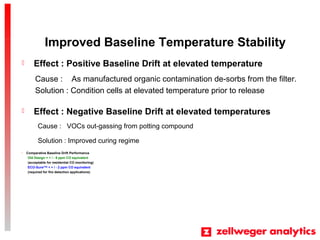
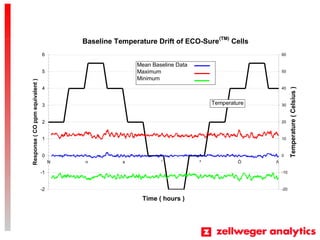
- 16. Improved Baseline Temperature Stability ? Effect : Positive Baseline Drift at elevated temperature ? Effect : Negative Baseline Drift at elevated temperatures ? Comparative Baseline Drift Performance Old Design = + / - 8 ppm CO equivalent (acceptable for residential CO monitoring) ECO-Sure(TM) < + / - 2 ppm CO equivalent (required for fire detection applications) Cause : As manufactured organic contamination de-sorbs from the filter. Solution : Condition cells at elevated temperature prior to release Cause : VOCs out-gassing from potting compound Solution : Improved curing regime
- 17. Baseline Temperature Drift of ECO-Sure(TM) Cells -2 -1 0 1 2 3 4 5 6 N n s ˇ° ? ? ? Time ( hours ) Response(COppmequivalent) -20 -10 0 10 20 30 40 50 60 Temperature(Celsius) Temperature Mean Baseline Data Maximum Minimum
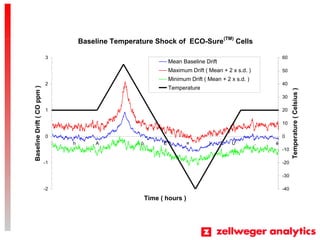
- 18. Baseline Temperature Shock of ECO-Sure(TM) Cells -2 -1 0 1 2 3 ? h A ¨° ? ˇč } U . ? Time ( hours ) BaselineDrift(COppm) -40 -30 -20 -10 0 10 20 30 40 50 60 Temperature(Celsius) Mean Baseline Drift Maximum Drift ( Mean + 2 x s.d. ) Minimum Drift ( Mean + 2 x s.d. ) Temperature
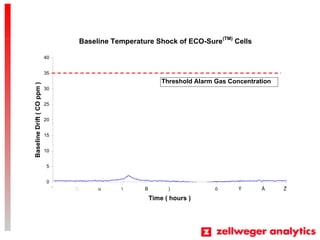
- 19. Baseline Temperature Shock of ECO-Sure(TM) Cells 0 5 10 15 20 25 30 35 40 ˇ§ ? u B ) ? ? ? ? Time ( hours ) BaselineDrift(COppm) Threshold Alarm Gas Concentration
- 20. ECO-Sure(TM) Product Summary Semi-automated production since March 2001 ? Two stages of process FMEA fed into automated production line ? Yields are recorded for continual process improvement ECO-Sure(TM) cells have been approved in instruments tested to : ? BS, LPC, VdS & UL2034 (due April, 2002) UL Component Recognition ? Advanced recognition scheme, monthly linearity test, maximum concentration measurement and continuous 15 ppm CO exposure ? Provisional recognition granted (Feb 2002) achieved on first submission
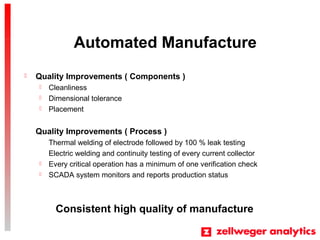
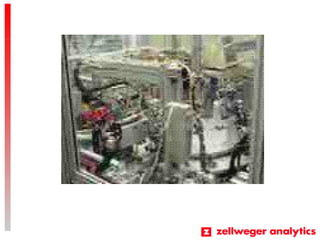
- 21. Automated Manufacture ? Quality Improvements ( Components ) ? Cleanliness ? Dimensional tolerance ? Placement Quality Improvements ( Process ) Thermal welding of electrode followed by 100 % leak testing Electric welding and continuity testing of every current collector ? Every critical operation has a minimum of one verification check ? SCADA system monitors and reports production status Consistent high quality of manufacture
- 23. Product Summary Product currently supplied in volume to multi-national fire and residential CO detector manufacturers Significant investment in automation to improve manufacturing process and increase throughput Significant improvement in cell performance to significantly exceed all current standards