Pivot tables -Excel
- 1. Pivot Tables Going into greater detail with data
- 2. Lesson Plan 1. Data Validation 2. Conditional Formatting 3. Pivot Tables Ensure the data is clean during input phase Visualizing the data. Looking for trends Deeper analysis
- 3. Swim in the data ocean
- 4. Dont use a bazooka on a fly
- 5. Pivot tables are good for Data presentation Correlation between variables
- 6. Pivot tables are easy - 1/3 Select all data
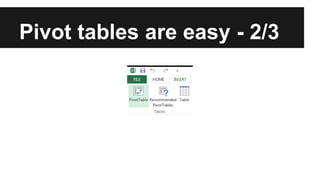
- 7. Pivot tables are easy - 2/3
- 8. Pivot tables are easy - 3/3 All data was selected
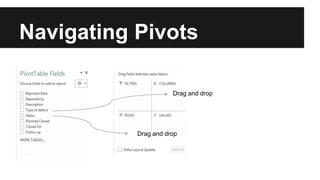
- 9. Navigating Pivots Drag and drop Drag and drop
- 10. Navigating Pivots - Rows
- 11. Navigating Pivots - Column
- 12. Navigating Pivots - Data 1/3 Where is the data?
- 13. Navigating Pivots - Data 2/3
- 14. Navigating Pivots - Data 3/3
- 15. Hands On Get those hands dirty!
- 16. Next Week Summary of what we have learnt so far: Data validation Conditional Formatting Pivot Tables
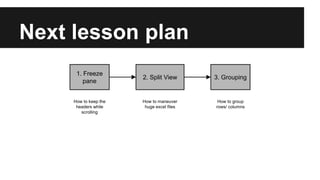
- 17. Next lesson plan 1. Freeze pane 2. Split View 3. Grouping How to keep the headers while scrolling How to maneuver huge excel files How to group rows/ columns

