Pivoting Wide Tables with Spark
- 1. PIVOTING WIDE TABLES WITH SPARK Sadik Bakiu, Data Reply, 17.02.2020
- 2. 1.Introduction 2.What is Pivot 3.Pivot in Spark 4.The other way 5.Tips and tricks AGENDA
- 3. INITIAL SET UP Fuel Efficiency Service Date Service Calls Production Date Avg. Speed BI Department ┬¦ Oracle Backend ┬¦ 11.000+ Features ┬¦ Sparsely populated table ┬¦ 1000 cols/table ┬¦ 12 tables ┬¦ Feature Engineering ┬¦ Input, row format
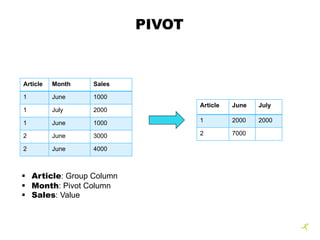
- 4. PIVOT Article Month Sales 1 June 1000 1 July 2000 1 June 1000 2 June 3000 2 June 4000 Article June July 1 2000 2000 2 7000 ┬¦ Article: Group Column ┬¦ Month: Pivot Column ┬¦ Sales: Value
- 5. PIVOT IN SPARK(1) Article Month Sales 1 June 1000 1 July 2000 1 June 1000 2 June 3000 2 June 4000 Article Array 1 [2000, 2000] 2 [7000, null] 2 (3) Step Implementation: 1. Group by Grouping and Pivot Column and aggregate 2. Group by Grouping Column, aggregations in array 3. Values are projected in columns Article June July 1 2000 2000 2 7000 Article Month Sales 1 June 2000 1 July 2000 2 June 7000 2. 3. 1. Pivot values [June, July]
- 6. PIVOT IN SPARK(2) Car Id Feat Name Feat Value 1 Category Truck 1 Color Blue 1 Type Box 2 Category Bus 2 Color Black Car Id Array 1 [ŌĆśTruckŌĆÖ, ŌĆśBlueŌĆÖ, ŌĆśBoxŌĆÖ] 2 [ŌĆśBusŌĆÖ, ŌĆśBlackŌĆÖ, null] Car Id Category Color Type 1 Truck Blue Box 2 Bus Black Car Id Feat Name Feat Value 1 Category Truck 1 Color Blue 1 Type Box 2 Category Bus 2 Color Black OUR CASE Pivot values [Category, Color, Type] 2. 3. 1.
- 7. PIVOT 3 Step Implementation: 1. Add column, mapCol as Map(Feature Name -> Feature Value) 2. Group by Grouping Column, collect_list(mapCol) 3. Project values to columns
- 8. PIVOT Car Id Feat Name Feat Value 1 Category Truck 1 Color Blue 1 Type Box 2 Category Bus 2 Color Black Car Id mapCol 1 Category -> Truck 1 Color -> Blue 1 Type -> Box 2 Category -> Bus 2 Color -> Black 1.
- 9. PIVOT Car Id maps 1 [(Category -> Truck), (Color -> Blue), (Type -> Box)] 2 [(Category -> Bus), (Color -> Black)] Car Id Category Color Type 1 Truck Blue Box 2 Bus Black 2. 3.
- 10. TABLE STRUCTURE Destination Table: 1. Only one table 2. Hive table on HDFS 3. Theoretically infinite columns 1. If you populate up to 2000 of them 4. Separate metadata from actual data
- 11. TIPS AND TRICKS spark.sql.pivotMaxValues ┬¦ Max number of distinct values in pivot column, default 10000 ┬¦ Can be changed
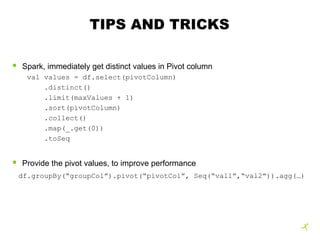
- 12. TIPS AND TRICKS ┬¦ Spark, immediately get distinct values in Pivot column val values = df.select(pivotColumn) .distinct() .limit(maxValues + 1) .sort(pivotColumn) .collect() .map(_.get(0)) .toSeq ┬¦ Provide the pivot values, to improve performance df.groupBy(ŌĆ£groupColŌĆØ).pivot(ŌĆ£pivotColŌĆØ, Seq(ŌĆ£val1ŌĆØ,ŌĆ£val2ŌĆØ)).agg(ŌĆ”)


![PIVOT IN SPARK(1)
Article Month Sales
1 June 1000
1 July 2000
1 June 1000
2 June 3000
2 June 4000
Article Array
1 [2000, 2000]
2 [7000, null]
2 (3) Step Implementation:
1. Group by Grouping and Pivot Column and aggregate
2. Group by Grouping Column, aggregations in array
3. Values are projected in columns
Article June July
1 2000 2000
2 7000
Article Month Sales
1 June 2000
1 July 2000
2 June 7000
2.
3.
1.
Pivot values [June, July]](https://image.slidesharecdn.com/masprestation-200218120144/85/Pivoting-Wide-Tables-with-Spark-5-320.jpg)
![PIVOT IN SPARK(2)
Car Id Feat Name Feat Value
1 Category Truck
1 Color Blue
1 Type Box
2 Category Bus
2 Color Black
Car Id Array
1 [ŌĆśTruckŌĆÖ, ŌĆśBlueŌĆÖ, ŌĆśBoxŌĆÖ]
2 [ŌĆśBusŌĆÖ, ŌĆśBlackŌĆÖ, null]
Car Id Category Color Type
1 Truck Blue Box
2 Bus Black
Car Id Feat Name Feat Value
1 Category Truck
1 Color Blue
1 Type Box
2 Category Bus
2 Color Black
OUR CASE
Pivot values [Category, Color, Type]
2. 3.
1.](https://image.slidesharecdn.com/masprestation-200218120144/85/Pivoting-Wide-Tables-with-Spark-6-320.jpg)


![PIVOT
Car Id maps
1 [(Category -> Truck), (Color -> Blue), (Type -> Box)]
2 [(Category -> Bus), (Color -> Black)]
Car Id Category Color Type
1 Truck Blue Box
2 Bus Black
2.
3.](https://image.slidesharecdn.com/masprestation-200218120144/85/Pivoting-Wide-Tables-with-Spark-9-320.jpg)


