Pix cone: A Real Use Case
0 likes575 views
The presentation showcases how to create a data-driven infographic using the pixcone tool, featuring steps like downloading open data on obesity and physical activity in England from a government database, importing it into pixcone, and generating charts. It emphasizes the importance of understanding data licensing through the UK Open Government Licence (OGL) and highlights the process of auto-generating and adjusting charts to create a complete infographic. The presentation concludes by inviting viewers to explore more resources on the pixcone website.
1 of 12
Ad
Recommended
DrTAD From Image to Vector to 3D Blender + Inkscape Tutorial
DrTAD From Image to Vector to 3D Blender + Inkscape TutorialFIDE Master Tihomir Dovramadjiev PhD
╠²
The document is a tutorial authored by Dr. Eng. Tihomir Dovramadjiev from the Technical University of Varna, guiding users on converting images to vector graphics and creating 3D models using Inkscape and Blender. It details the functionalities of Inkscape as an open-source vector graphics editor and offers step-by-step instructions for processing images for 3D rendering in Blender. Additionally, the tutorial includes resources for both software applications and emphasizes the significance of SVG as a standard format for design work.PESTLEWeb 49 Facts
PESTLEWeb 49 FactsPESTLEWeb
╠²
This document provides instructions for contributing facts to the PESTLEWeb library to support the site's analysis tools. It outlines a "Fact Drive" where users are asked to contribute 49 facts. The 4 step process involves registering on the site, opening the drawing canvas, adding facts under the PESTLE categories, and saving the diagram. Suggested topics for facts include different industries, countries, issues. The goal is to build a 7x7 grid of crowd-sourced facts to enrich analysis on the site.PixCone Presentazione a Istat DataLab, Smart City Exhibition 2013
PixCone Presentazione a Istat DataLab, Smart City Exhibition 2013fraricce
╠²
Il documento presenta Pixcone, un'applicazione web per la creazione di infografiche che separa i dati dal layout e offre un ecosistema di plugin. L'obiettivo ├© rendere accessibile la creazione di infografiche a tutti, incluse funzionalit├Ā per designer esperti e aggiornamenti con nuovi dati. Inoltre, promuove il progetto attraverso una registrazione gratuita per gli utenti interessati.Hypo&hyperthyroidism
Hypo&hyperthyroidismLanie Lyn Alog
╠²
Hyperthyroidism and hypothyroidism are conditions related to an overactive or underactive thyroid gland. Hyperthyroidism is caused by Graves' disease or thyroiditis and can be treated with anti-thyroid medications, radioactive iodine, or surgery. Hypothyroidism is caused by iodine deficiency or Hashimoto's thyroiditis and is treated with synthetic thyroid hormone medication.MERCALTA RETAIL TOOLBOX MEXICOMercalta Consultoria
╠²
Mercalta es la primera firma de consultor├Ła en retail y mercadotecnia en M├®xico con 20 a├▒os de experiencia internacional. Ofrece una variedad de servicios de consultor├Ła, marketing, capacitaci├│n y m├Īs para mejorar los resultados econ├│micos de los clientes a trav├®s de la implementaci├│n de mejores pr├Īcticas. Ha trabajado con varias empresas exitosas en casos como el dise├▒o de estrategias comerciales, reconfiguraci├│n de modelos de negocio y apertura de tiendas.THERMOFAST BROCHURE
THERMOFAST BROCHUREMarios Polycarpou
╠²
Thermofast Ltd is a private company established in 1987 in Cyprus that deals with sales and installation of heating, cooling, and energy systems. It aims to be the leading supplier of LPG and central heating systems through high quality service, technical expertise, and environmental protection. The company was one of the first to introduce LPG boilers, polyethylene pipes, underfloor heating systems, and other innovative solutions to the Cypriot market. It offers a wide range of products from brands like Wirsbo, Duofil, THERMIC, and ALEZIO heat pumps.Epaswmm5 user manual
Epaswmm5 user manualhoussem1
╠²
This document provides a user's manual for version 5.0 of the Storm Water Management Model (SWMM). SWMM is a dynamic rainfall-runoff simulation model used to simulate urban flooding, combined and sanitary sewer overflows, and other water quality issues. The manual describes SWMM's conceptual modeling framework including its representation of drainage systems, hydrologic processes, water quality constituents, and computational methods. It also provides guidance on using SWMM's interface and capabilities for setting up simulation projects, drawing drainage system schematics, running simulations, and reviewing results.PixCone Product Tour
PixCone Product Tourfraricce
╠²
PixCone is a free web app that allows users to easily create infographics. It has a canvas where users can arrange charts, images, text, and shapes with total creative freedom and no fixed templates. Users can save their infographics to the cloud, export them to use elsewhere, and access additional features with a free basic account. The document provides an overview of PixCone's features for adding various visual elements to infographics.Data Science: Harnessing Open Data for High Impact Solutions
Data Science: Harnessing Open Data for High Impact SolutionsMohd Izhar Firdaus Ismail
╠²
This document provides an overview of open data and applications created using open data from various government sources. It introduces Mohd Izhar Firdaus Ismail and his background working with data. Examples of open data applications from Data.gov (US) and Data.gov.uk (UK) are described that address issues like locating alternative fuel stations, planning farming activities based on weather, and choosing a college based on affordability. Tips are provided for getting started with data work, including cleaning, analyzing and visualizing data using open source tools like Python libraries, Apache Zeppelin and Hortonworks.How we can understand the world through open data
How we can understand the world through open dataMarie Gustafsson Friberger
╠²
The document discusses open data and how it can be used to understand the world. It describes how open government data and open data in general can increase transparency and create value when more people can access and utilize data. The document outlines possible paths for organizations to publish open data, factors for success, and how to ensure quality. It also discusses combining data from different sources and using standards to better integrate and link open data.The web of data: how are we doing so far
The web of data: how are we doing so farElena Simperl
╠²
The document summarizes the current state of open data and the web of data. It discusses how data is being shared online through datasets, digital traces, and algorithms. While there is a lot of annotated data available, especially about locations and businesses, uptake of linked data and vocabulary reuse is still low. The document also reviews guidelines for improving data organization, discoverability, documentation, and engagement. Finally, it discusses ongoing research on data search behavior, sensemaking practices, and the potential for generative AI to help with data understanding and reuse.The web of data: how are we doing so far?
The web of data: how are we doing so far?Elena Simperl
╠²
This document summarizes Elena Simperl's presentation on "The web of data: how are we doing so far?". Some key points:
- The web has shaped our understanding and interactions with data in many ways like answering questions, sharing data online, and publishing data for others to use.
- However, the theory and practice of the web of data are different, and we are at a crucial moment in how data is published and used on the web.
- Open data portals need to improve in areas like adopting standards, co-locating documentation, and making data more usable and discoverable in order to increase data reuse.City Forward and Open Data Standards
City Forward and Open Data StandardsIBM Analytics
╠²
The document discusses the increasing urbanization of the global population and emphasizes the importance of open data in enhancing city life and decision-making. It highlights the challenges and legalities involved in accessing and integrating city-related data while noting initiatives by governments and organizations to make data more available. Additionally, it emphasizes the significance of corporate citizenship in addressing societal issues and improving the impact of data on communities.Big Ugly Datasets For Thumb-Fingered Journalists
Big Ugly Datasets For Thumb-Fingered JournalistsOpen Journalism on the Open Web
╠²
This document provides guidance for journalists on acquiring and analyzing large datasets. It discusses the increasing availability of open data from sources like social media, governments, and the web. While such data holds opportunities for insights, it can be difficult for individual journalists to work with due to its size and complexity. The document then offers tips on properly understanding, cleaning, loading, analyzing, and sharing data. Key steps include determining data quality, asking the right questions, iterating analyses, and consulting experts. Journalists are assigned a hypothetical project involving selecting a publicly available dataset, planning its cleaning and analysis, and considering how results will be expressed and limitations addressed.Lorena Pocatilu - strategies for smart city knowledge platform and open data
Lorena Pocatilu - strategies for smart city knowledge platform and open datatu1204
╠²
The document discusses strategies for implementing smart city knowledge platforms and open data. It describes how knowledge platforms can provide access to new information, open data, connect users, and enable collaboration and innovation. As more people live in cities, knowledge platforms and open data can help manage information more efficiently to improve quality of life. Successful implementation requires addressing barriers like cultures opposed to openness and data quality problems. Open data offers opportunities to analyze and visualize data from different sources which is important for addressing societal challenges in smart cities. Several initiatives for open data are also described.Autodiscovery or The long tail of open data
Autodiscovery or The long tail of open dataConnected Data World
╠²
The document discusses the challenges and benefits of sharing open data within organizations, emphasizing the importance of autodiscovery and interoperability to enhance data accessibility. It outlines various reasons organizations are hesitant to share data, including fear of misuse and complexity, and offers solutions to promote data sharing through easy-to-use tools and properly structured datasets. Finally, it highlights the role of organizational profile documents in facilitating the discovery and management of open datasets.Open Data Presentation
Open Data PresentationSaviour Sanders
╠²
The document discusses the importance of open data in empowering researchers, communities, and developers to address development challenges by making data accessible, searchable, and easily usable. It outlines methods for finding, managing, and visualizing data while promoting the principles of linked open data that enhance interoperability and community engagement. The document also emphasizes the creation of a data ecosystem that connects diverse stakeholders and encourages the development of applications that leverage open data.Exploration, visualization and querying of linked open data sources
Exploration, visualization and querying of linked open data sourcesLaura Po
╠²
The document outlines a training session focused on exploring, visualizing, and querying linked open data sources, emphasizing practical sessions like searching datasets from datahub and exploring various open data portals, particularly in Europe. It discusses tools such as CKAN for dataset management, along with the importance of data quality, accessibility, and the benefits of open government data. Additionally, it touches upon methods for data visualization and analysis, as well as exercises for understanding and navigating national open data portals.dssi 10 12
dssi 10 12Dawn Zehner
╠²
The open web provides statistical and data content in an unorganized manner without the ability to sort or filter results. Library portals to statistical providers offer inconsistent access and dead links. Users drilling down publicly available datasets are left blindly searching or only getting a small amount of information online. Statistical Insight offers a single, friendly interface providing access to over 70,000 reports, 1 million tables, and 700,000 spreadsheets across 5,500 datasets in an organized collection focused specifically on statistical content.Broad Data
Broad DataJames Hendler
╠²
The document discusses the concept of "Broad Data" which refers to the large amount of freely available but widely varied open data on the World Wide Web, including structured and semi-structured data. It provides examples such as the growing linked open data cloud and over 710,000 datasets available from governments around the world. Broad data poses new challenges for data search, modeling, integration and visualization of partially modeled datasets. International open government data search and linking government data to additional contexts are also discussed.Getting Open Data Used
Getting Open Data UsedAndrew Stott
╠²
The document discusses strategies for getting open data used, including focusing on data that interests people, making data easy to access and reuse through common licensing and standards, and engaging with developers and the public to promote use. It provides examples of open data projects that have generated significant economic and social benefits through new applications and insights, while noting challenges in fully measuring these impacts. Overall it argues for open data as a "transport investment" that can yield high returns with the right approach.open-data-presentation.pptx
open-data-presentation.pptxDennicaRivera
╠²
1) Journalists are increasingly expected to analyze data to uncover stories and trends, rather than just report on isolated events.
2) Open data from sources like governments and communities can be used with tools like Excel, Google Fusion Tables, and Tableau to clean, visualize, and analyze information.
3) Effective data stories connect different types of data to provide context and insight into issues, rather than just describing events. Personalizing stories for readers can also make data journalism more engaging.Being open, accessible, and understandable by Jonathan Challener, OECD - #ima...
Being open, accessible, and understandable by Jonathan Challener, OECD - #ima...Jonathan Challener
╠²
The document discusses the evolving concept of open data, emphasizing its accessibility and usability for diverse audiences, including non-expert users. It highlights the merging of different data types, the importance of easy consumption, and the need for innovative applications, such as apps that help users locate free food based on public data. Project Delta aims to improve OECD data accessibility through a user-friendly portal and a variety of data products to better meet user needs.DataGraft: Data-as-a-Service for Open Data
DataGraft: Data-as-a-Service for Open Datadapaasproject
╠²
The document provides an overview of Linked (Open) Data including RDF, RDFS and SPARQL. It defines key concepts such as Linked Data principles of using URIs to identify things on the web and describing relationships between them. It describes RDF's basic data model of subject-predicate-object triples to make statements about resources and the RDF serialization formats of Turtle and JSON-LD. It also mentions semantic query language SPARQL for querying RDF data.Using Open Data - David Tarrant
Using Open Data - David TarrantgodanSec
╠²
The document discusses the importance of discovering open data, focusing on aspects such as data quality, provenance, and visualization techniques. It emphasizes the need to establish trust in data sources, the role of open data in policy cycles, and strategies for effective data analysis and publication. Additionally, it highlights tools for cleaning and visualizing data, and encourages the documentation and sharing of research data to enhance its impact.Using data effectively worskhop presentation
Using data effectively worskhop presentationcommunitylincs
╠²
This document discusses the value of data for non-profit organizations. It explains that data can help organizations better target services, improve advocacy and fundraising, and demonstrate impact. The document provides examples of open government data sources and case studies of organizations using data effectively. It also discusses potential barriers to using data and where organizations can find help and support.APLIC 2012: Discovering & Dealing with Data
APLIC 2012: Discovering & Dealing with Dataksilk
╠²
Kimberly Silk presented on data management and discovery at the Martin Prosperity Institute. The MPI collects large social science datasets from various common and authoritative sources to support research. To better organize their growing collection, the MPI implemented an open data discovery platform called Dataverse to catalog and provide access to their datasets. Open data initiatives aim to make certain government data freely available to the public, but also present challenges around data preparation, support, and responsiveness. Big data refers to extremely large datasets beyond the capabilities of typical database tools, and data visualization is an important way to communicate insights from data.Open Data for Economic and Social Development:
Why Government Should Care
Open Data for Economic and Social Development:
Why Government Should CareAndrew Stott
╠²
This document discusses the benefits of open data for governments and societies. It argues that open data can lead to new economic and social value through improved public services, more transparent government, and more efficient government. It provides examples from the UK and other countries that demonstrate how open data has increased business activity, boosted public sector savings, improved health and education services, and held government more accountable. However, it also notes potential concerns from data owners and the need to address risks and find compromises to enable greater data sharing.FIDO Seminar: Perspectives on Passkeys & Consumer Adoption.pptx
FIDO Seminar: Perspectives on Passkeys & Consumer Adoption.pptxFIDO Alliance
╠²
FIDO Seminar: Perspectives on Passkeys & Consumer AdoptionOpenACC and Open Hackathons Monthly Highlights June 2025
OpenACC and Open Hackathons Monthly Highlights June 2025OpenACC
╠²
The OpenACC organization focuses on enhancing parallel computing skills and advancing interoperability in scientific applications through hackathons and training. The upcoming 2025 Open Accelerated Computing Summit (OACS) aims to explore the convergence of AI and HPC in scientific computing and foster knowledge sharing. This year's OACS welcomes talk submissions from a variety of topics, from Using Standard Language Parallelism to Computer Vision Applications. The document also highlights several open hackathons, a call to apply for NVIDIA Academic Grant Program and resources for optimizing scientific applications using OpenACC directives.More Related Content
Similar to Pix cone: A Real Use Case (20)
Data Science: Harnessing Open Data for High Impact Solutions
Data Science: Harnessing Open Data for High Impact SolutionsMohd Izhar Firdaus Ismail
╠²
This document provides an overview of open data and applications created using open data from various government sources. It introduces Mohd Izhar Firdaus Ismail and his background working with data. Examples of open data applications from Data.gov (US) and Data.gov.uk (UK) are described that address issues like locating alternative fuel stations, planning farming activities based on weather, and choosing a college based on affordability. Tips are provided for getting started with data work, including cleaning, analyzing and visualizing data using open source tools like Python libraries, Apache Zeppelin and Hortonworks.How we can understand the world through open data
How we can understand the world through open dataMarie Gustafsson Friberger
╠²
The document discusses open data and how it can be used to understand the world. It describes how open government data and open data in general can increase transparency and create value when more people can access and utilize data. The document outlines possible paths for organizations to publish open data, factors for success, and how to ensure quality. It also discusses combining data from different sources and using standards to better integrate and link open data.The web of data: how are we doing so far
The web of data: how are we doing so farElena Simperl
╠²
The document summarizes the current state of open data and the web of data. It discusses how data is being shared online through datasets, digital traces, and algorithms. While there is a lot of annotated data available, especially about locations and businesses, uptake of linked data and vocabulary reuse is still low. The document also reviews guidelines for improving data organization, discoverability, documentation, and engagement. Finally, it discusses ongoing research on data search behavior, sensemaking practices, and the potential for generative AI to help with data understanding and reuse.The web of data: how are we doing so far?
The web of data: how are we doing so far?Elena Simperl
╠²
This document summarizes Elena Simperl's presentation on "The web of data: how are we doing so far?". Some key points:
- The web has shaped our understanding and interactions with data in many ways like answering questions, sharing data online, and publishing data for others to use.
- However, the theory and practice of the web of data are different, and we are at a crucial moment in how data is published and used on the web.
- Open data portals need to improve in areas like adopting standards, co-locating documentation, and making data more usable and discoverable in order to increase data reuse.City Forward and Open Data Standards
City Forward and Open Data StandardsIBM Analytics
╠²
The document discusses the increasing urbanization of the global population and emphasizes the importance of open data in enhancing city life and decision-making. It highlights the challenges and legalities involved in accessing and integrating city-related data while noting initiatives by governments and organizations to make data more available. Additionally, it emphasizes the significance of corporate citizenship in addressing societal issues and improving the impact of data on communities.Big Ugly Datasets For Thumb-Fingered Journalists
Big Ugly Datasets For Thumb-Fingered JournalistsOpen Journalism on the Open Web
╠²
This document provides guidance for journalists on acquiring and analyzing large datasets. It discusses the increasing availability of open data from sources like social media, governments, and the web. While such data holds opportunities for insights, it can be difficult for individual journalists to work with due to its size and complexity. The document then offers tips on properly understanding, cleaning, loading, analyzing, and sharing data. Key steps include determining data quality, asking the right questions, iterating analyses, and consulting experts. Journalists are assigned a hypothetical project involving selecting a publicly available dataset, planning its cleaning and analysis, and considering how results will be expressed and limitations addressed.Lorena Pocatilu - strategies for smart city knowledge platform and open data
Lorena Pocatilu - strategies for smart city knowledge platform and open datatu1204
╠²
The document discusses strategies for implementing smart city knowledge platforms and open data. It describes how knowledge platforms can provide access to new information, open data, connect users, and enable collaboration and innovation. As more people live in cities, knowledge platforms and open data can help manage information more efficiently to improve quality of life. Successful implementation requires addressing barriers like cultures opposed to openness and data quality problems. Open data offers opportunities to analyze and visualize data from different sources which is important for addressing societal challenges in smart cities. Several initiatives for open data are also described.Autodiscovery or The long tail of open data
Autodiscovery or The long tail of open dataConnected Data World
╠²
The document discusses the challenges and benefits of sharing open data within organizations, emphasizing the importance of autodiscovery and interoperability to enhance data accessibility. It outlines various reasons organizations are hesitant to share data, including fear of misuse and complexity, and offers solutions to promote data sharing through easy-to-use tools and properly structured datasets. Finally, it highlights the role of organizational profile documents in facilitating the discovery and management of open datasets.Open Data Presentation
Open Data PresentationSaviour Sanders
╠²
The document discusses the importance of open data in empowering researchers, communities, and developers to address development challenges by making data accessible, searchable, and easily usable. It outlines methods for finding, managing, and visualizing data while promoting the principles of linked open data that enhance interoperability and community engagement. The document also emphasizes the creation of a data ecosystem that connects diverse stakeholders and encourages the development of applications that leverage open data.Exploration, visualization and querying of linked open data sources
Exploration, visualization and querying of linked open data sourcesLaura Po
╠²
The document outlines a training session focused on exploring, visualizing, and querying linked open data sources, emphasizing practical sessions like searching datasets from datahub and exploring various open data portals, particularly in Europe. It discusses tools such as CKAN for dataset management, along with the importance of data quality, accessibility, and the benefits of open government data. Additionally, it touches upon methods for data visualization and analysis, as well as exercises for understanding and navigating national open data portals.dssi 10 12
dssi 10 12Dawn Zehner
╠²
The open web provides statistical and data content in an unorganized manner without the ability to sort or filter results. Library portals to statistical providers offer inconsistent access and dead links. Users drilling down publicly available datasets are left blindly searching or only getting a small amount of information online. Statistical Insight offers a single, friendly interface providing access to over 70,000 reports, 1 million tables, and 700,000 spreadsheets across 5,500 datasets in an organized collection focused specifically on statistical content.Broad Data
Broad DataJames Hendler
╠²
The document discusses the concept of "Broad Data" which refers to the large amount of freely available but widely varied open data on the World Wide Web, including structured and semi-structured data. It provides examples such as the growing linked open data cloud and over 710,000 datasets available from governments around the world. Broad data poses new challenges for data search, modeling, integration and visualization of partially modeled datasets. International open government data search and linking government data to additional contexts are also discussed.Getting Open Data Used
Getting Open Data UsedAndrew Stott
╠²
The document discusses strategies for getting open data used, including focusing on data that interests people, making data easy to access and reuse through common licensing and standards, and engaging with developers and the public to promote use. It provides examples of open data projects that have generated significant economic and social benefits through new applications and insights, while noting challenges in fully measuring these impacts. Overall it argues for open data as a "transport investment" that can yield high returns with the right approach.open-data-presentation.pptx
open-data-presentation.pptxDennicaRivera
╠²
1) Journalists are increasingly expected to analyze data to uncover stories and trends, rather than just report on isolated events.
2) Open data from sources like governments and communities can be used with tools like Excel, Google Fusion Tables, and Tableau to clean, visualize, and analyze information.
3) Effective data stories connect different types of data to provide context and insight into issues, rather than just describing events. Personalizing stories for readers can also make data journalism more engaging.Being open, accessible, and understandable by Jonathan Challener, OECD - #ima...
Being open, accessible, and understandable by Jonathan Challener, OECD - #ima...Jonathan Challener
╠²
The document discusses the evolving concept of open data, emphasizing its accessibility and usability for diverse audiences, including non-expert users. It highlights the merging of different data types, the importance of easy consumption, and the need for innovative applications, such as apps that help users locate free food based on public data. Project Delta aims to improve OECD data accessibility through a user-friendly portal and a variety of data products to better meet user needs.DataGraft: Data-as-a-Service for Open Data
DataGraft: Data-as-a-Service for Open Datadapaasproject
╠²
The document provides an overview of Linked (Open) Data including RDF, RDFS and SPARQL. It defines key concepts such as Linked Data principles of using URIs to identify things on the web and describing relationships between them. It describes RDF's basic data model of subject-predicate-object triples to make statements about resources and the RDF serialization formats of Turtle and JSON-LD. It also mentions semantic query language SPARQL for querying RDF data.Using Open Data - David Tarrant
Using Open Data - David TarrantgodanSec
╠²
The document discusses the importance of discovering open data, focusing on aspects such as data quality, provenance, and visualization techniques. It emphasizes the need to establish trust in data sources, the role of open data in policy cycles, and strategies for effective data analysis and publication. Additionally, it highlights tools for cleaning and visualizing data, and encourages the documentation and sharing of research data to enhance its impact.Using data effectively worskhop presentation
Using data effectively worskhop presentationcommunitylincs
╠²
This document discusses the value of data for non-profit organizations. It explains that data can help organizations better target services, improve advocacy and fundraising, and demonstrate impact. The document provides examples of open government data sources and case studies of organizations using data effectively. It also discusses potential barriers to using data and where organizations can find help and support.APLIC 2012: Discovering & Dealing with Data
APLIC 2012: Discovering & Dealing with Dataksilk
╠²
Kimberly Silk presented on data management and discovery at the Martin Prosperity Institute. The MPI collects large social science datasets from various common and authoritative sources to support research. To better organize their growing collection, the MPI implemented an open data discovery platform called Dataverse to catalog and provide access to their datasets. Open data initiatives aim to make certain government data freely available to the public, but also present challenges around data preparation, support, and responsiveness. Big data refers to extremely large datasets beyond the capabilities of typical database tools, and data visualization is an important way to communicate insights from data.Open Data for Economic and Social Development:
Why Government Should Care
Open Data for Economic and Social Development:
Why Government Should CareAndrew Stott
╠²
This document discusses the benefits of open data for governments and societies. It argues that open data can lead to new economic and social value through improved public services, more transparent government, and more efficient government. It provides examples from the UK and other countries that demonstrate how open data has increased business activity, boosted public sector savings, improved health and education services, and held government more accountable. However, it also notes potential concerns from data owners and the need to address risks and find compromises to enable greater data sharing.Being open, accessible, and understandable by Jonathan Challener, OECD - #ima...
Being open, accessible, and understandable by Jonathan Challener, OECD - #ima...Jonathan Challener
╠²
Recently uploaded (20)
FIDO Seminar: Perspectives on Passkeys & Consumer Adoption.pptx
FIDO Seminar: Perspectives on Passkeys & Consumer Adoption.pptxFIDO Alliance
╠²
FIDO Seminar: Perspectives on Passkeys & Consumer AdoptionOpenACC and Open Hackathons Monthly Highlights June 2025
OpenACC and Open Hackathons Monthly Highlights June 2025OpenACC
╠²
The OpenACC organization focuses on enhancing parallel computing skills and advancing interoperability in scientific applications through hackathons and training. The upcoming 2025 Open Accelerated Computing Summit (OACS) aims to explore the convergence of AI and HPC in scientific computing and foster knowledge sharing. This year's OACS welcomes talk submissions from a variety of topics, from Using Standard Language Parallelism to Computer Vision Applications. The document also highlights several open hackathons, a call to apply for NVIDIA Academic Grant Program and resources for optimizing scientific applications using OpenACC directives.FIDO Seminar: Authentication for a Billion Consumers - Amazon.pptx
FIDO Seminar: Authentication for a Billion Consumers - Amazon.pptxFIDO Alliance
╠²
FIDO Seminar: Authentication for a Billion Consumers - AmazonCan We Use Rust to Develop Extensions for PostgreSQL? (POSETTE: An Event for ...
Can We Use Rust to Develop Extensions for PostgreSQL? (POSETTE: An Event for ...NTT DATA Technology & Innovation
╠²
Can We Use Rust to Develop Extensions for PostgreSQL?
(POSETTE: An Event for Postgres 2025)
June 11, 2025
Shinya Kato
NTT DATA Japan CorporationENERGY CONSUMPTION CALCULATION IN ENERGY-EFFICIENT AIR CONDITIONER.pdf
ENERGY CONSUMPTION CALCULATION IN ENERGY-EFFICIENT AIR CONDITIONER.pdfMuhammad Rizwan Akram
╠²
DC Inverter Air Conditioners are revolutionizing the cooling industry by delivering affordable,
energy-efficient, and environmentally sustainable climate control solutions. Unlike conventional
fixed-speed air conditioners, DC inverter systems operate with variable-speed compressors that
modulate cooling output based on demand, significantly reducing energy consumption and
extending the lifespan of the appliance.
These systems are critical in reducing electricity usage, lowering greenhouse gas emissions, and
promoting eco-friendly technologies in residential and commercial sectors. With advancements in
compressor control, refrigerant efficiency, and smart energy management, DC inverter air conditioners
have become a benchmark in sustainable climate control solutionscnc-processing-centers-centateq-p-110-en.pdf
cnc-processing-centers-centateq-p-110-en.pdfAmirStern2
╠²
ū×ū©ūøū¢ ūóūÖūæūĢūōūÖūØ ū¬ūóū®ūÖūÖū¬ūÖ ūæūóū£ 3/4/5 ū”ūÖū©ūÖūØ, ūóūō 22 ūöūŚū£ūżūĢū¬ ūøū£ūÖūØ ūóūØ ūøū£ ūÉūżū®ū©ūĢūÖūĢū¬ ūöūóūÖūæūĢūō ūöūōū©ūĢū®ūĢū¬.╠²ūæūóū£ ū®ūśūŚ ūóūæūĢūōūö ūÆūōūĢū£ ūĢū×ūŚū®ūæ ūĀūĢūŚ ūĢū¦ū£ ū£ūöūżūóū£ūö ūæū®ūżūö ūöūóūæū©ūÖū¬/ū©ūĢūĪūÖū¬/ūÉūĀūÆū£ūÖū¬/ūĪūżū©ūōūÖū¬/ūóū©ūæūÖū¬ ūĢūóūĢūō..
ū×ūĪūĢūÆū£ ū£ūæū”ūó ūżūóūĢū£ūĢū¬ ūóūÖūæūĢūō ū®ūĢūĀūĢū¬ ūöū×ū¬ūÉūÖū×ūĢū¬ ū£ūóūĀūżūÖūØ ū®ūĢūĀūÖūØ: ū¦ūÖūōūĢūŚ ūÉūĀūøūÖ, ūÉūĢūżū¦ūÖ, ūĀūÖūĪūĢū©, ūĢūøū©ūĪūĢūØ ūÉūĀūøūÖ.Creating Inclusive Digital Learning with AI: A Smarter, Fairer Future
Creating Inclusive Digital Learning with AI: A Smarter, Fairer FutureImpelsys Inc.
╠²
Have you ever struggled to read a tiny label on a medicine box or tried to navigate a confusing website? Now imagine if every learning experience felt that wayŌĆöevery single day.
For millions of people living with disabilities, poorly designed content isnŌĆÖt just frustrating. ItŌĆÖs a barrier to growth. Inclusive learning is about fixing that. And today, AI is helping us build digital learning thatŌĆÖs smarter, kinder, and accessible to everyone.
Accessible learning increases engagement, retention, performance, and inclusivity for everyone. Inclusive design is simply better design.Smarter Aviation Data Management: Lessons from Swedavia Airports and Sweco
Smarter Aviation Data Management: Lessons from Swedavia Airports and SwecoSafe Software
╠²
Managing airport and airspace data is no small task, especially when youŌĆÖre expected to deliver it in AIXM format without spending a fortune on specialized tools. But what if there was a smarter, more affordable way?
Join us for a behind-the-scenes look at how Sweco partnered with Swedavia, the Swedish airport operator, to solve this challenge using FME and Esri.
Learn how they built automated workflows to manage periodic updates, merge airspace data, and support data extracts ŌĆō all while meeting strict government reporting requirements to the Civil Aviation Administration of Sweden.
Even better? Swedavia built custom services and applications that use the FME Flow REST API to trigger jobs and retrieve results ŌĆō streamlining tasks like securing the quality of new surveyor data, creating permdelta and baseline representations in the AIS schema, and generating AIXM extracts from their AIS data.
To conclude, FME expert Dean Hintz will walk through a GeoBorders reading workflow and highlight recent enhancements to FMEŌĆÖs AIXM (Aeronautical Information Exchange Model) processing and interpretation capabilities.
Discover how airports like Swedavia are harnessing the power of FME to simplify aviation data management, and how you can too.June Patch Tuesday
June Patch TuesdayIvanti
╠²
IvantiŌĆÖs Patch Tuesday breakdown goes beyond patching your applications and brings you the intelligence and guidance needed to prioritize where to focus your attention first. Catch early analysis on our Ivanti blog, then join industry expert Chris Goettl for the Patch Tuesday Webinar Event. There weŌĆÖll do a deep dive into each of the bulletins and give guidance on the risks associated with the newly-identified vulnerabilities. "Database isolation: how we deal with hundreds of direct connections to the d...
"Database isolation: how we deal with hundreds of direct connections to the d...Fwdays
╠²
What can go wrong if you allow each service to access the database directly? In a startup, this seems like a quick and easy solution, but as the system scales, problems appear that no one could have guessed.
In my talk, I'll share Solidgate's experience in transforming its architecture: from the chaos of direct connections to a service-based data access model. I will talk about the transition stages, bottlenecks, and how isolation affected infrastructure support. I will honestly show what worked and what didn't. In short, we will analyze the controversy of this talk.No-Code Workflows for CAD & 3D Data: Scaling AI-Driven Infrastructure
No-Code Workflows for CAD & 3D Data: Scaling AI-Driven InfrastructureSafe Software
╠²
When projects depend on fast, reliable spatial data, every minute counts.
AI Clearing needed a faster way to handle complex spatial data from drone surveys, CAD designs and 3D project models across construction sites. With FME Form, they built no-code workflows to clean, convert, integrate, and validate dozens of data formats ŌĆō cutting analysis time from 5 hours to just 30 minutes.
Join us, our partner Globema, and customer AI Clearing to see how they:
-Automate processing of 2D, 3D, drone, spatial, and non-spatial data
-Analyze construction progress 10x faster and with fewer errors
-Handle diverse formats like DWG, KML, SHP, and PDF with ease
-Scale their workflows for international projects in solar, roads, and pipelines
If you work with complex data, join us to learn how to optimize your own processes and transform your results with FME.FIDO Seminar: Evolving Landscape of Post-Quantum Cryptography.pptx
FIDO Seminar: Evolving Landscape of Post-Quantum Cryptography.pptxFIDO Alliance
╠²
FIDO Seminar: Evolving Landscape of Post-Quantum CryptographyAI VIDEO MAGAZINE - June 2025 - r/aivideo
AI VIDEO MAGAZINE - June 2025 - r/aivideo1pcity Studios, Inc
╠²
AI VIDEO MAGAZINE - r/aivideo community newsletter ŌĆō Exclusive Tutorials: How to make an AI VIDEO from scratch, PLUS: How to make AI MUSIC, Hottest ai videos of 2025, Exclusive Interviews, New Tools, Previews, and MORE - JUNE 2025 ISSUE -OpenPOWER Foundation & Open-Source Core Innovations
OpenPOWER Foundation & Open-Source Core InnovationsIBM
╠²
penPOWER offers a fully open, royalty-free CPU architecture for custom chip design.
It enables both lightweight FPGA cores (like Microwatt) and high-performance processors (like POWER10).
Developers have full access to source code, specs, and tools for end-to-end chip creation.
It supports AI, HPC, cloud, and embedded workloads with proven performance.
Backed by a global community, it fosters innovation, education, and collaboration.PyCon SG 25 - Firecracker Made Easy with Python.pdf
PyCon SG 25 - Firecracker Made Easy with Python.pdfMuhammad Yuga Nugraha
╠²
Explore the ease of managing Firecracker microVM with the firecracker-python. In this session, I will introduce the basics of Firecracker microVM and demonstrate how this custom SDK facilitates microVM operations easily. We will delve into the design and development process behind the SDK, providing a behind-the-scenes look at its creation and features. While traditional Firecracker SDKs were primarily available in Go, this module brings a simplicity of Python to the table.From Manual to Auto Searching- FME in the Driver's Seat
From Manual to Auto Searching- FME in the Driver's SeatSafe Software
╠²
Finding a specific car online can be a time-consuming task, especially when checking multiple dealer websites. A few years ago, I faced this exact problem while searching for a particular vehicle in New Zealand. The local classified platform, Trade Me (similar to eBay), wasnŌĆÖt yielding any results, so I expanded my search to second-hand dealer sitesŌĆöonly to realise that periodically checking each one was going to be tedious. ThatŌĆÖs when I noticed something interesting: many of these websites used the same platform to manage their inventories. Recognising this, I reverse-engineered the platformŌĆÖs structure and built an FME workspace that automated the search process for me. By integrating API calls and setting up periodic checks, I received real-time email alerts when matching cars were listed. In this presentation, IŌĆÖll walk through how I used FME to save hours of manual searching by creating a custom car-finding automation system. While FME canŌĆÖt buy a car for youŌĆöyetŌĆöit can certainly help you find the one youŌĆÖre after!FIDO Seminar: Targeting Trust: The Future of Identity in the Workforce.pptx
FIDO Seminar: Targeting Trust: The Future of Identity in the Workforce.pptxFIDO Alliance
╠²
FIDO Seminar: Targeting Trust: The Future of Identity in the WorkforceThe Future of Data, AI, and AR: Innovation Inspired by You.pdf
The Future of Data, AI, and AR: Innovation Inspired by You.pdfSafe Software
╠²
The future of FME is inspired by you. We can't wait to show you what's ahead for FME and Safe Software. Can We Use Rust to Develop Extensions for PostgreSQL? (POSETTE: An Event for ...
Can We Use Rust to Develop Extensions for PostgreSQL? (POSETTE: An Event for ...NTT DATA Technology & Innovation
╠²
Ad
Pix cone: A Real Use Case
- 1. PixCone: A Real Use Case Creating a real data-driven infographic with PixCone Francesco Ricceri Software Architect and Author of PixCone
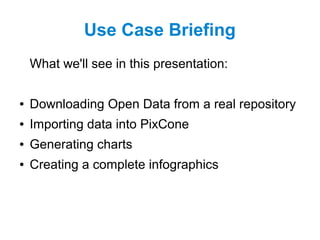
- 2. PixCone Use Case Briefing What we'll see in this presentation: ŌŚÅ Downloading Open Data from a real case ŌŚÅ Import data into PixCone ŌŚÅ Generate charts ŌŚÅ Create a complete infographic
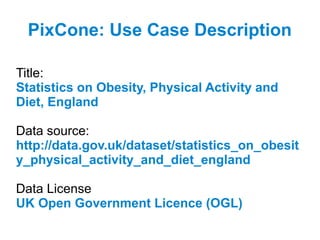
- 3. PixCone Use Case Description Title: Statistics on Obesity, Physical Activity and Diet, England Data source: http://data.gov.uk/dataset/statistics_on_obesit y_physical_activity_and_diet_england Data License UK Open Government Licence (OGL)
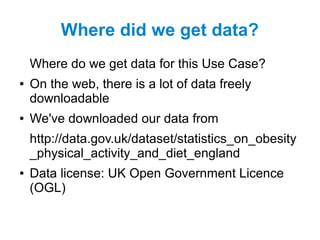
- 4. Where did we get data? Where do we get data for this Use Case? ŌŚÅ On the web, there is a lot of data freely downloadable ŌŚÅ We've downloaded our data from http://data.gov.uk/dataset/statistics_on_obesity _physical_activity_and_diet_england ŌŚÅ Data license: UK Open Government Licence (OGL)
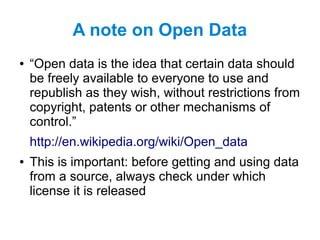
- 5. A note on Open Data ŌŚÅ ŌĆ£Open data is the idea that certain data should be freely available to everyone to use and republish as they wish, without restrictions from copyright, patents or other mechanisms of control.ŌĆØ http://en.wikipedia.org/wiki/Open_data ŌŚÅ This is important: before getting and using data from a source, always check under which license it is released
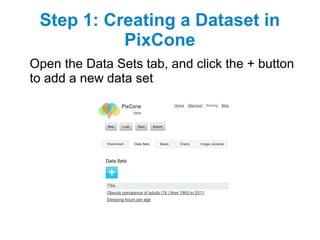
- 6. Step 1: Creating a Dataset in PixCone Open the Data Sets tab, and click the + button to add a new data set
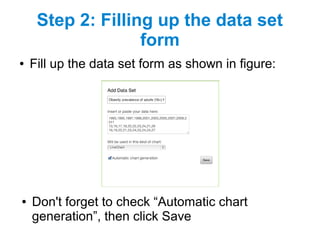
- 7. Step 2: Filling up the data set form ŌŚÅ Fill up the data set form as shown in figure: ŌŚÅ Don't forget to check ŌĆ£Automatic chart generationŌĆØ, then click Save
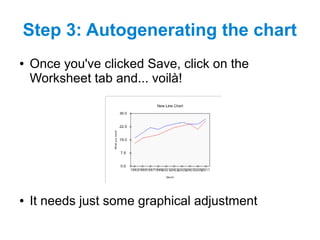
- 8. Step 3: Autogenerating the chart ŌŚÅ Once you've clicked Save, click on the Worksheet tab and... voil├Ā! ŌŚÅ It needs just some graphical adjustment
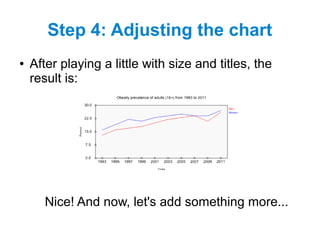
- 9. Step 4: Adjusting the chart ŌŚÅ After playing a little with size and titles, the result is: Nice! And now, let's add something more...
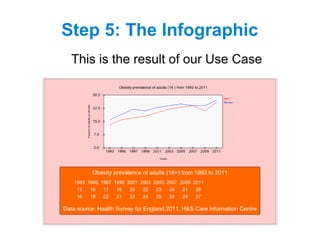
- 10. Step 5: The Infographic This is the result of our Use Case
- 11. PixCone Use Case Debriefing What did we see in this Use Case? ŌŚÅ How to use a real data set to create an infographic ŌŚÅ How to let PixCone autogenerate charts for us ŌŚÅ How to use PixCone to adjust our charts to create an infographic ŌŚÅ An introduction to the concept of Open Data End of presentation
- 12. To know more... PixCone website www.pixcone.com PixCone is free to use! Get your account at www.pixcone.com/subscription To get help, tutorials and videos, visit www.pixcone.com/docs