PMBOK 6th ed Formulas.pdf
- 1. Presenter: Barb Waters, MBA, PMP PMP® Exam Prep 6th Edition: Formulas
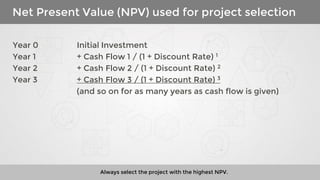
- 2. Net Present Value (NPV) used for project selection Always select the project with the highest NPV. Year 0 Initial Investment Year 1 + Cash Flow 1 / (1 + Discount Rate) 1 Year 2 + Cash Flow 2 / (1 + Discount Rate) 2 Year 3 + Cash Flow 3 / (1 + Discount Rate) 3 (and so on for as many years as cash flow is given)
- 3. Program Evaluation and Review Technique (PERT) PERT / Weighted Duration / 3-Point estimate Triangular distribution Beta distribution Standard Deviation [O+ML+P]/3 [O+ (4*ML) +P]/6 SD = (P-O)/6 Only use this if the question specifies that all inputs should be weighted equally Default to this unless question specifies that all inputs are weighted equally Reserve time
- 4. Risk Rating (qualitative risk analysis) Used during qualitative risk analysis Risk Rating = Probability x Impact Answer is expressed as a % or decimal
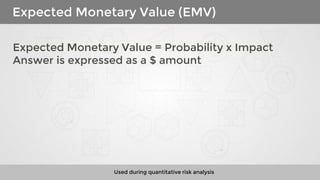
- 5. Expected Monetary Value (EMV) Used during quantitative risk analysis Expected Monetary Value = Probability x Impact Answer is expressed as a $ amount
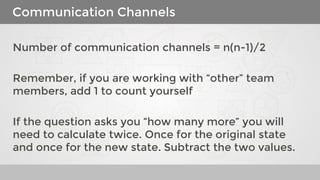
- 6. Communication Channels Number of communication channels = n(n-1)/2 Remember, if you are working with “other” team members, add 1 to count yourself If the question asks you “how many more” you will need to calculate twice. Once for the original state and once for the new state. Subtract the two values.
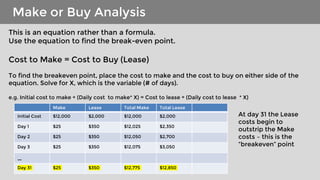
- 7. Make or Buy Analysis This is an equation rather than a formula. Use the equation to find the break-even point. Cost to Make = Cost to Buy (Lease) To find the breakeven point, place the cost to make and the cost to buy on either side of the equation. Solve for X, which is the variable (# of days). e.g. Initial cost to make + (Daily cost to make* X) = Cost to lease + (Daily cost to lease * X) Make Lease Total Make Total Lease Initial Cost $12,000 $2,000 $12,000 $2,000 Day 1 $25 $350 $12,025 $2,350 Day 2 $25 $350 $12,050 $2,700 Day 3 $25 $350 $12,075 $3,050 … Day 31 $25 $350 $12,775 $12,850 At day 31 the Lease costs begin to outstrip the Make costs – this is the “breakeven” point
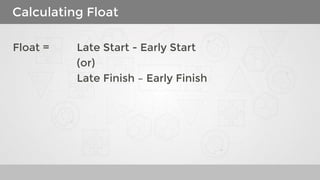
- 8. Calculating Float Float = Late Start - Early Start (or) Late Finish – Early Finish
- 9. Planned Value (PV) PV = Budget at Completion * Percent of Time Passed
- 10. Earned Value (EV) EV = Budget at Completion * Percent of Work Completed
- 11. Actual Cost (AC) The amount of money spent on approved project work to-date. This number is usually given to you. It may also be presented as Budget at Completion (BAC) – Money Left = AC
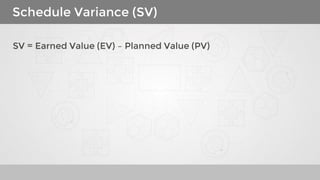
- 12. Schedule Variance (SV) SV = Earned Value (EV) – Planned Value (PV)
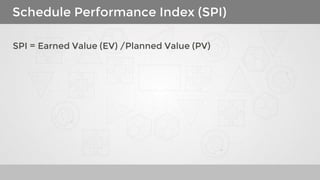
- 13. Schedule Performance Index (SPI) SPI = Earned Value (EV) /Planned Value (PV)
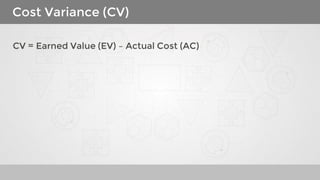
- 14. Cost Variance (CV) CV = Earned Value (EV) – Actual Cost (AC)
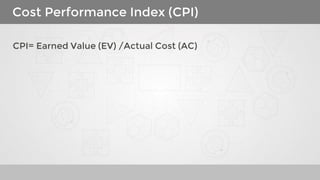
- 15. Cost Performance Index (CPI) CPI= Earned Value (EV) /Actual Cost (AC)
- 16. Estimate at Completion (EAC) There are four different formulas based on different scenarios Scenario #1: Assumes the same rate of spending will continue EAC = BAC/CPI Scenario #2: Assumes you have deviated from the budget due to a one-time incident, but spending would have otherwise been on track with the plan and will continue at the planned rate going forward EAC = AC + (BAC – EV), or this formula can be formatted as EAC = BAC – CV Scenario #3: Cost performance has been poor and project deadline is firm EAC = AC + {(BAC-EV)/(CPI x SPI)} Scenario #4: Assumes the original budget was flawed. The formula considers actual cost, and reassesses the cost of all remaining work (Estimate to Complete, or ETC). EAC = AC + ETC
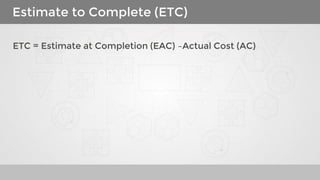
- 17. Estimate to Complete (ETC) ETC = Estimate at Completion (EAC) –Actual Cost (AC)
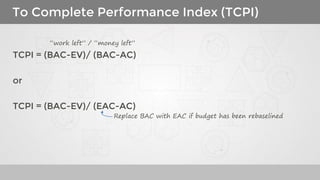
- 18. To Complete Performance Index (TCPI) “work left” / “money left” TCPI = (BAC-EV)/ (BAC-AC) or TCPI = (BAC-EV)/ (EAC-AC) Replace BAC with EAC if budget has been rebaselined
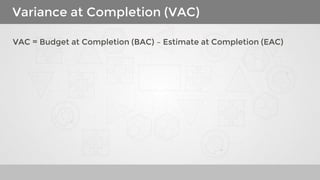
- 19. Variance at Completion (VAC) VAC = Budget at Completion (BAC) – Estimate at Completion (EAC)
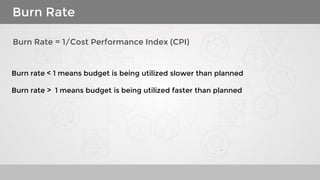
- 20. Burn Rate Burn Rate = 1/Cost Performance Index (CPI) Burn rate < 1 means budget is being utilized slower than planned Burn rate > 1 means budget is being utilized faster than planned

![Program Evaluation and Review Technique (PERT)
PERT / Weighted Duration / 3-Point estimate
Triangular
distribution
Beta distribution Standard Deviation
[O+ML+P]/3 [O+ (4*ML) +P]/6 SD = (P-O)/6
Only use this if the
question specifies
that all inputs
should be weighted
equally
Default to this unless
question specifies that
all inputs are weighted
equally
Reserve time](https://image.slidesharecdn.com/pmbok6thedformulas-221008083452-221e3ee6/85/PMBOK-6th-ed-Formulas-pdf-3-320.jpg)

