POLYNOMIALS,CURVEFITTING, AND INTERPOLATION
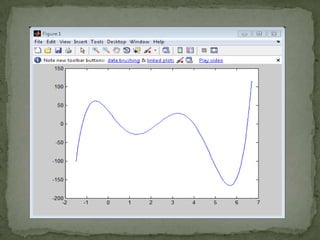
- 7. >> p=[1 -12.1 40.59 -17.015 -71.95 35.88] >> r=roots(p) r= 6.5000 4.0000 2.3000 -1.2000 0.5000
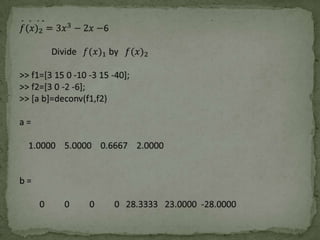
- 12. 6x-2
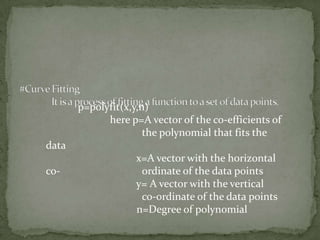
- 13. p=polyfit(x,y,n) here p=A vector of the co-efficients of the polynomial that fits the data co- x=A vector with the horizontal ordinate of the data points y= A vector with the vertical co-ordinate of the data points n=Degree of polynomial
- 14. Here, ŌĆśnearestŌĆÖ : returns the value of the data point that is nearest to the yi = interpl (x, y, xi, ŌĆśmethodŌĆÖ) interpolated point ŌĆślinearŌĆÖ : uses linear spline interpolation ŌĆśsplineŌĆÖ : uses cubic spline interpolation yi = It is Interpolated value ŌĆśpchipŌĆÖ : uses piecewise cubic Hermite interpolation x = It is a vector with horizontal co-ordinate of the input data points y = It is a vector with vertical co-ordinate of the input data points xi = Horizontal co-ordinate of the interpolation point
- 17. >> x=[0:1.0:5]; y=[1.0 -0.6242 -1.4707 3.2406 -0.7366 -6.3717]; xi=[0:0.1:5]; yilin=interpl(x,y,xi,'linear'); yispl=interpl(x,y,xi,'spline'); yipch=interpl(x,y,xi,'pchip'); yfun=1.5.^xi*cos(2*xi); subplot(1,3,1) plot(x,y,'o'xi,yfun,xi,yilin,'--'); subpolt(1,3,2) plot(x,y,'o',xi,yfun,xi,yispl,'--'); subplot(1,3,3) plot(x,y,'o',xi,yfun,xi,yipch,'--')
- 22. Mesh & Surface plots are created in three steps: *create a grid in the x-y plane *calculate the value of z at each point of the grid *create the plot
- 24. >> x=-1:0.1:3; >> y=1:0.1:4; >> [X,Y]=meshgrid(x,y); >> Z=X.*Y.^2./(X.^2+Y.^2); >> mesh(X,Y,Z) >> xlabel('x'); >> ylabel('y'); >> zlabel('z');




![>> p=[1 -12.1 40.59 -17.015 -71.95 35.88]
>> r=roots(p)
r=
6.5000
4.0000
2.3000
-1.2000
0.5000](https://image.slidesharecdn.com/lecture2-131016235814-phpapp02/85/POLYNOMIALS-CURVEFITTING-AND-INTERPOLATION-7-320.jpg)





![>> x=[0:1.0:5];
y=[1.0 -0.6242 -1.4707 3.2406 -0.7366 -6.3717];
xi=[0:0.1:5];
yilin=interpl(x,y,xi,'linear');
yispl=interpl(x,y,xi,'spline');
yipch=interpl(x,y,xi,'pchip');
yfun=1.5.^xi*cos(2*xi);
subplot(1,3,1)
plot(x,y,'o'xi,yfun,xi,yilin,'--');
subpolt(1,3,2)
plot(x,y,'o',xi,yfun,xi,yispl,'--');
subplot(1,3,3)
plot(x,y,'o',xi,yfun,xi,yipch,'--')](https://image.slidesharecdn.com/lecture2-131016235814-phpapp02/85/POLYNOMIALS-CURVEFITTING-AND-INTERPOLATION-17-320.jpg)



![>> x=-1:0.1:3;
>> y=1:0.1:4;
>> [X,Y]=meshgrid(x,y);
>> Z=X.*Y.^2./(X.^2+Y.^2);
>> mesh(X,Y,Z)
>> xlabel('x');
>> ylabel('y');
>> zlabel('z');](https://image.slidesharecdn.com/lecture2-131016235814-phpapp02/85/POLYNOMIALS-CURVEFITTING-AND-INTERPOLATION-24-320.jpg)