porosity log
- 1. Porosity logging Department of petroleum engineering Soran university Present by : Reband azad raza
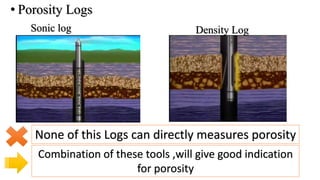
- 2. âĒ Porosity Logs Sonic log Density Log None of this Logs can directly measures porosity Combination of these tools ,will give good indication for porosity
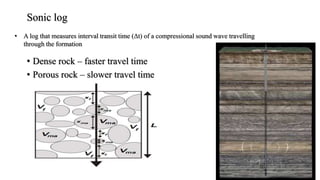
- 3. âĒ A log that measures interval transit time (Ît) of a compressional sound wave travelling through the formation Sonic log âĒ Dense rock â faster travel time âĒ Porous rock â slower travel time
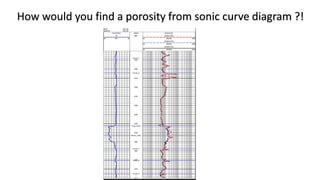
- 4. How would you find a porosity from sonic curve diagram ?!
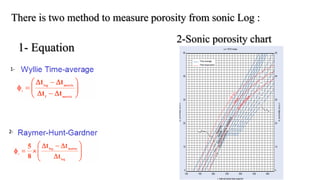
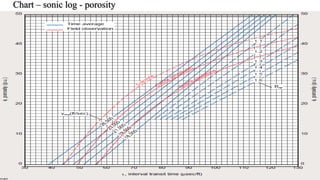
- 5. There is two method to measure porosity from sonic Log : 1- Equation 2-Sonic porosity chart 1- 2-
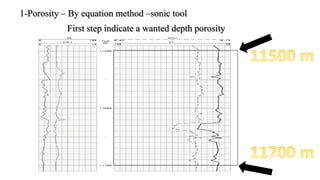
- 6. 1-Porosity â By equation method âsonic tool First step indicate a wanted depth porosity
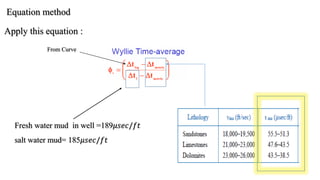
- 7. Apply this equation : From Curve c Fresh water mud in well =189ðð ðð/ððĄ salt water mud= 185ðð ðð/ððĄ Equation method
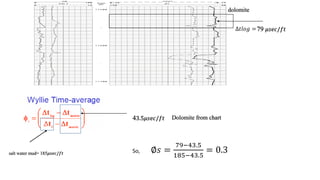
- 8. dolomite 43.5ðð ðð/ððĄ c salt water mud= 185ðð ðð/ððĄ 79 ðð ðð/ððĄâðĄððð = So, â ð = 79â43.5 185â43.5 = 0.3 Dolomite from chart
- 9. Chart â sonic log - porosity
- 10. Density log The density logging tool is made up of: - a radioactive source of either Cs-137 or Co-60 The gamma rays enter the surrounding rocks where some are absorbed. It has 2 detectors âĒ Long range âĒ Short range
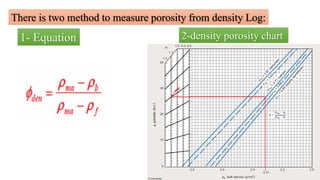
- 11. There is two method to measure porosity from density Log: 1- Equation 2-density porosity chart
- 12. Apply this equation : Equation method PeMaterial 2.648Sand 3.76Shale 2.71Limestone 2.876Dolomite 2.032Salt 2.977Anhydrite From curve Fresh water mud in well =1.0ðð/ðð3 salt water mud= 1.1ðð/ðð3
- 13. dolomite2.876 ðð/ðð3 salt water mud= 1.1ðð/ðð3 So, â ð = 2.876â2.6 2.876â1.1 = 0.155
- 14. Chart â density log - porosity
- 15. Any Question ? !

