ºÝºÝߣ

ºÝºÝߣShare a Scribd company logo
Micro-relief and geometry of ice-wedge polygons in Adventdalen (Svalbard, Norway)
                                                                                                                              M. Lousada(1), M. Jorge(2), J. Saraiva(1,3), P. Pina(1), and G. Vieira(2)

                                                                                                     (1)Instituto   Superior T¨¦cnico, Lisboa, Portugal, (2)CEG / IGOT, Lisboa, Portugal, (3)UNIS, Longyearbyen, Norway
Research developed within the project ANAPOLIS (PTDC/CTE-SPA/099041/2008),funded by FCT (Portugal)


                                                                                                                                      INTRODUCTION
  Ice-wedge polygons mostly occur in flat areas, but they have also been found in slopes with gradients as high as 25¡ã; in these cases, they are commonly elongated in the
  downward direction. However, even seemingly flat terrains exhibit small-scale topography; in this work, we conduct a detailed analysis of polygon shape in relation with micro-
  relief in a polygonal network in the Adventdalen valley, in Svalbard (Norway). In the frame of the ANAPOLIS (Analysis of Polygonal Terrains on Mars based on Earth Analogues)
  project, we have made two field campaigns to fully characterize an extensive polygonal network (with an area circa 40,000 m2) in this periglacial area in the Arctic (78¡ã N).


                                                                                                                         METHODS                                                                                                        RESULTS                        Adventdalen Topographic map and ESRI Base Maps


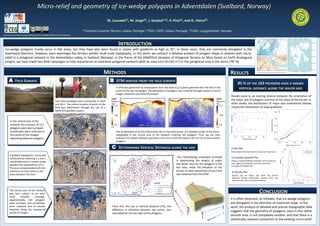
       A FIELD SURVEYS                                                                                                          B DTM DERIVED FROM THE FIELD SURVEYS                                                                            85 % OF THE 163 POLYGONS HAVE A HIGHER
                                                                                                                                     A DTM was generated by interpolation from the 8166 (x,y,z) points gathered with the GPS in the              VERTICAL DISTANCE ALONG THE MAJOR AXIS
                                                                                                                                    course of the two campaigns. The delineation of polygons was achieved through analysis of aerial
                                                                                                                                    images combined with field information.
                                                                                                                                                                                                                                        Results point to an existing relation between the orientation of
                                                                            Two field campaigns were conducted, in 2010                                                                                                                 the major axis of polygons and that of the slope of the terrain; in
                                                                            and 2011. The precise location of points in the                                                                                                             other words, the distribution of major axis orientations follows
                                                                            field was determined through the use of a                                                                                                                   closely the distribution of slope gradients.
                                                                            GNSS-RTK geodetic system.                                                                                                                                                                                                    2
                                                                                                                                                                                                                                            1


         In the central area of the
         network, the contours of 121
         polygons were also surveyed.
         Coordinates were collected at                                                                                              The combination of all that information led to the construction of a detailed model of the micro-
         the centre of the troughs                                                                                                  topography in the central area of the network, covering 163 polygons. Thus, we can now
         separating adjacent polygons.                                                                                              evaluate the relation between geometry and micro-relief fluctuations for this set of low-centred
                                                                                                                                    polygons.

                                                                                                                                 C DETERMINING VERTICAL DISTANCES ALONG THE AXIS                                                        1) Box Plot                                                               3
                                                                                                                                                                                                                                        Shows higher Vertical Distance values for major axis.
         A gridded topographic survey was
         conducted by collecting x, y and z                                                                                                                                                  The methodology employed consisted         2) Quantile-Quantile Plot
         coordinates every 5 meters along                                                                                                                                                   in determining the lengths of major         Shows a marked difference between VDs for the two
                                                                                                                                                                                            and minor axes for the polygons in the      axes, again illustrating the fact that major axes
         parallel lines separated by 10 m.                                                                                                                                                                                              correspond to higher VDs
         This was complemented with the                                                                                                                                                     test area, while the elevation of the
         collection of more points in the                                                                                                                                                   terrain on both extremities of each axis    3) Density Plot
         areas between the lines.                                                                                                                                                           was obtained from the DTM.                  Density plot for Major and minor axis vertical
                                                                                                                                                                                                                                        distances density distributions. Several minor axis
                                                                                                                                                                                                                                        have less then 20 cm of vertical distance.


        The central part of the network
        was later subject to an even                                                                                                                                                                                                                                     CONCLUSION
        more        detailed   coverage.
        Approximately 150 polygons                                                                                                                                                                                                      It is often observed, on hillsides, that ice-wedge polygons
        were surveyed, and coordinates                                                                                                                                                                                                  are elongated in the direction of maximum slope. In this
        were collected also at several                                                                                           From this, the rise or Vertical Distance (VD), the                                                     work, the analysis of detailed and precise topographic data
        locations along the transversal                                                                                          difference in elevation between two points, was
        profile of troughs.
                                                                                                                                                                                                                                        suggests that the geometry of polygons, even in this rather
                                                                                                                                 calculated for the two axes of the polygons.
                                                                                                                                                                                                                                        smooth area, is not completely random, and that there is a
                                                                                                                                                                                                                                        statistically relevant connection to the existing micro-relief .
Ad

Recommended

Active layer thaw depth
Maura Lousada
?
ArcGis geodatabase
ArcGis geodatabase
Maura Lousada
?
MODELA??O DO SOLO-PAISAGEM ¨C A IMPORT?NCIA DA LOCALIZA??O
Ricardo Brasil
?
SOM-VIS
SOM-VIS
Stig-Arne Kristoffersen
?
PhD defence - Steven Vanonckelen
Steven Vanonckelen
?
Ravasi_etal_EAGE2015b
Matteo Ravasi
?
Grp4 outlook bot april 2011 v2
World Agroforestry (ICRAF)
?
A2100107
A2100107
ajmrdjournals
?
Automated Extraction of Landforms from DEM Data
Bob MacMillan
?
A simple pre-operational model for the portuguese coast
griflet
?
Critical Water Resource Monitoring - Sana?a Basin / Yemen
Global Risk Forum GRFDavos
?
Mid-Term Seminar
Mid-Term Seminar
santoshborate2
?
Gps geodetic cors
Gps geodetic cors
Alam survey
?
VO Course 11: Spatial indexing
Joint ALMA Observatory
?
Semester End Seminar
santoshborate2
?
Applied Geospatial Sciences Assignment
Joshua Brunsdon
?
Isprsarchives xl-7-w3-897-2015
bayrmgl
?
Kibby Basin, Nevada "LITHIUM PROJECT" Geophysical Review
Follow me on Twitter @Stockshaman
?
M.Tech Final Seminar
santoshborate2
?
Aster vnir & swir band enhancement for lithological mapping a case study of...
Alexander Decker
?
Vrancea1 cor 6 6 2016 (2)
MGU
?
THE IMPORTANCE OF SAMPLING FOR THE EFFICIENCY OF ARTIFICIAL NEURAL NETWORKS I...
Ricardo Brasil
?
Satellite Image Based Mapping of Wetland Tundra Landscapes Using ILWIS GIS
Universit?t Salzburg
?
Using Artificial Neural Networks for Digital Soil Mapping ¨C a comparison of M...
Ricardo Brasil
?
[Geog_3080_Assignment 4]Terrain Mapping Report_Richmond Ho Shing Yu (T00017284)
[Geog_3080_Assignment 4]Terrain Mapping Report_Richmond Ho Shing Yu (T00017284)
Richmond Ho Shing Yu
?
Structural interpretation of abakiliki ¨C ugep, using
Alexander Decker
?
IGARSS2011-Villa.ppt
grssieee
?
2012. Ice-wedge polygons geodatabase - poster
Marco Jorge
?
Contraction pol¨ªgonal networks, topologic characterization
Maura Lousada
?
THE QUALITATIVE ANALYZE OF THE CARTOGRAPHICAL PROJECTIONS USED IN ROMANIA
mihai_herbei
?

More Related Content

What's hot (19)

Automated Extraction of Landforms from DEM Data
Bob MacMillan
?
A simple pre-operational model for the portuguese coast
griflet
?
Critical Water Resource Monitoring - Sana?a Basin / Yemen
Global Risk Forum GRFDavos
?
Mid-Term Seminar
Mid-Term Seminar
santoshborate2
?
Gps geodetic cors
Gps geodetic cors
Alam survey
?
VO Course 11: Spatial indexing
Joint ALMA Observatory
?
Semester End Seminar
santoshborate2
?
Applied Geospatial Sciences Assignment
Joshua Brunsdon
?
Isprsarchives xl-7-w3-897-2015
bayrmgl
?
Kibby Basin, Nevada "LITHIUM PROJECT" Geophysical Review
Follow me on Twitter @Stockshaman
?
M.Tech Final Seminar
santoshborate2
?
Aster vnir & swir band enhancement for lithological mapping a case study of...
Alexander Decker
?
Vrancea1 cor 6 6 2016 (2)
MGU
?
THE IMPORTANCE OF SAMPLING FOR THE EFFICIENCY OF ARTIFICIAL NEURAL NETWORKS I...
Ricardo Brasil
?
Satellite Image Based Mapping of Wetland Tundra Landscapes Using ILWIS GIS
Universit?t Salzburg
?
Using Artificial Neural Networks for Digital Soil Mapping ¨C a comparison of M...
Ricardo Brasil
?
[Geog_3080_Assignment 4]Terrain Mapping Report_Richmond Ho Shing Yu (T00017284)
[Geog_3080_Assignment 4]Terrain Mapping Report_Richmond Ho Shing Yu (T00017284)
Richmond Ho Shing Yu
?
Structural interpretation of abakiliki ¨C ugep, using
Alexander Decker
?
IGARSS2011-Villa.ppt
grssieee
?
Automated Extraction of Landforms from DEM Data
Bob MacMillan
?
A simple pre-operational model for the portuguese coast
griflet
?
Critical Water Resource Monitoring - Sana?a Basin / Yemen
Global Risk Forum GRFDavos
?
Applied Geospatial Sciences Assignment
Joshua Brunsdon
?
Isprsarchives xl-7-w3-897-2015
bayrmgl
?
Aster vnir & swir band enhancement for lithological mapping a case study of...
Alexander Decker
?
Vrancea1 cor 6 6 2016 (2)
MGU
?
THE IMPORTANCE OF SAMPLING FOR THE EFFICIENCY OF ARTIFICIAL NEURAL NETWORKS I...
Ricardo Brasil
?
Satellite Image Based Mapping of Wetland Tundra Landscapes Using ILWIS GIS
Universit?t Salzburg
?
Using Artificial Neural Networks for Digital Soil Mapping ¨C a comparison of M...
Ricardo Brasil
?
[Geog_3080_Assignment 4]Terrain Mapping Report_Richmond Ho Shing Yu (T00017284)
[Geog_3080_Assignment 4]Terrain Mapping Report_Richmond Ho Shing Yu (T00017284)
Richmond Ho Shing Yu
?
Structural interpretation of abakiliki ¨C ugep, using
Alexander Decker
?
IGARSS2011-Villa.ppt
grssieee
?

Similar to Micro-relief and polygon geometry (20)

2012. Ice-wedge polygons geodatabase - poster
Marco Jorge
?
Contraction pol¨ªgonal networks, topologic characterization
Maura Lousada
?
THE QUALITATIVE ANALYZE OF THE CARTOGRAPHICAL PROJECTIONS USED IN ROMANIA
mihai_herbei
?
Hengl & Reuter poster at Geomorphometry.org/2011
Tomislav Hengl
?
WE2.TO9.1.pdf
WE2.TO9.1.pdf
grssieee
?
02 Geographic scripting in uDig - halfway between user and developer
Andrea Antonello
?
Sp Abook Compiled Page Added Lowres
abhishekbij
?
GIS-Landslide Meeting ¤ªÊÖÝXµØÐΜyÁ¿ 2011-11-26
Hokkaido University
?
Geographic inf system
Raviteja Chowdary Adusumalli
?
Digital Ortho Image Creation of Hall County Aerial Photos Paper
mpadams77
?
Research Prospects with Geoinformatics
Suddhasheel GHOSH, PhD
?
Front Yard Geophysics
Ali Osman ?ncel
?
Altrichter, Geyer, Barrett VT Research Day Poster 2010
Adam Altrichter
?
MAP MAKING FROM TABLES
ijcga
?
MAP MAKING FROM TABLES
ijcga
?
Comparison of Geodatabase Terrain Pyramiding Methods for Airborne Laser Scann...
GeoCommunity
?
FME and the Chicago Region Environmental and Transportation Efficiency Program
Safe Software
?
Unit - 3 Concept of Geographical Information System
Mukilan N
?
Cialdea & Sollazzo - input2012
INPUT 2012
?
Geography of microwave survey
Madhukar Varshney
?
2012. Ice-wedge polygons geodatabase - poster
Marco Jorge
?
Contraction pol¨ªgonal networks, topologic characterization
Maura Lousada
?
THE QUALITATIVE ANALYZE OF THE CARTOGRAPHICAL PROJECTIONS USED IN ROMANIA
mihai_herbei
?
Hengl & Reuter poster at Geomorphometry.org/2011
Tomislav Hengl
?
WE2.TO9.1.pdf
WE2.TO9.1.pdf
grssieee
?
02 Geographic scripting in uDig - halfway between user and developer
Andrea Antonello
?
Sp Abook Compiled Page Added Lowres
abhishekbij
?
GIS-Landslide Meeting ¤ªÊÖÝXµØÐΜyÁ¿ 2011-11-26
Hokkaido University
?
Digital Ortho Image Creation of Hall County Aerial Photos Paper
mpadams77
?
Altrichter, Geyer, Barrett VT Research Day Poster 2010
Adam Altrichter
?
MAP MAKING FROM TABLES
ijcga
?
MAP MAKING FROM TABLES
ijcga
?
Comparison of Geodatabase Terrain Pyramiding Methods for Airborne Laser Scann...
GeoCommunity
?
FME and the Chicago Region Environmental and Transportation Efficiency Program
Safe Software
?
Unit - 3 Concept of Geographical Information System
Mukilan N
?
Cialdea & Sollazzo - input2012
INPUT 2012
?
Ad

Micro-relief and polygon geometry

  • 1. Micro-relief and geometry of ice-wedge polygons in Adventdalen (Svalbard, Norway) M. Lousada(1), M. Jorge(2), J. Saraiva(1,3), P. Pina(1), and G. Vieira(2) (1)Instituto Superior T¨¦cnico, Lisboa, Portugal, (2)CEG / IGOT, Lisboa, Portugal, (3)UNIS, Longyearbyen, Norway Research developed within the project ANAPOLIS (PTDC/CTE-SPA/099041/2008),funded by FCT (Portugal) INTRODUCTION Ice-wedge polygons mostly occur in flat areas, but they have also been found in slopes with gradients as high as 25¡ã; in these cases, they are commonly elongated in the downward direction. However, even seemingly flat terrains exhibit small-scale topography; in this work, we conduct a detailed analysis of polygon shape in relation with micro- relief in a polygonal network in the Adventdalen valley, in Svalbard (Norway). In the frame of the ANAPOLIS (Analysis of Polygonal Terrains on Mars based on Earth Analogues) project, we have made two field campaigns to fully characterize an extensive polygonal network (with an area circa 40,000 m2) in this periglacial area in the Arctic (78¡ã N). METHODS RESULTS Adventdalen Topographic map and ESRI Base Maps A FIELD SURVEYS B DTM DERIVED FROM THE FIELD SURVEYS 85 % OF THE 163 POLYGONS HAVE A HIGHER A DTM was generated by interpolation from the 8166 (x,y,z) points gathered with the GPS in the VERTICAL DISTANCE ALONG THE MAJOR AXIS course of the two campaigns. The delineation of polygons was achieved through analysis of aerial images combined with field information. Results point to an existing relation between the orientation of Two field campaigns were conducted, in 2010 the major axis of polygons and that of the slope of the terrain; in and 2011. The precise location of points in the other words, the distribution of major axis orientations follows field was determined through the use of a closely the distribution of slope gradients. GNSS-RTK geodetic system. 2 1 In the central area of the network, the contours of 121 polygons were also surveyed. Coordinates were collected at The combination of all that information led to the construction of a detailed model of the micro- the centre of the troughs topography in the central area of the network, covering 163 polygons. Thus, we can now separating adjacent polygons. evaluate the relation between geometry and micro-relief fluctuations for this set of low-centred polygons. C DETERMINING VERTICAL DISTANCES ALONG THE AXIS 1) Box Plot 3 Shows higher Vertical Distance values for major axis. A gridded topographic survey was conducted by collecting x, y and z The methodology employed consisted 2) Quantile-Quantile Plot coordinates every 5 meters along in determining the lengths of major Shows a marked difference between VDs for the two and minor axes for the polygons in the axes, again illustrating the fact that major axes parallel lines separated by 10 m. correspond to higher VDs This was complemented with the test area, while the elevation of the collection of more points in the terrain on both extremities of each axis 3) Density Plot areas between the lines. was obtained from the DTM. Density plot for Major and minor axis vertical distances density distributions. Several minor axis have less then 20 cm of vertical distance. The central part of the network was later subject to an even CONCLUSION more detailed coverage. Approximately 150 polygons It is often observed, on hillsides, that ice-wedge polygons were surveyed, and coordinates are elongated in the direction of maximum slope. In this were collected also at several From this, the rise or Vertical Distance (VD), the work, the analysis of detailed and precise topographic data locations along the transversal difference in elevation between two points, was profile of troughs. suggests that the geometry of polygons, even in this rather calculated for the two axes of the polygons. smooth area, is not completely random, and that there is a statistically relevant connection to the existing micro-relief .