Poverty and inequality
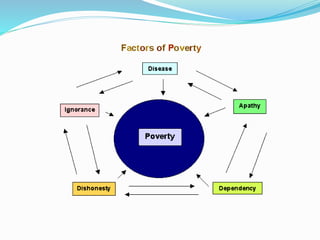
- 2. POVERTY Poverty is general scarcity, dearth, or the state of one who lacks a certain amount of material possessions or money.
- 3. Absolute & Relative Poverty ï Absolute Poverty refers to the lack of means necessary to meet basic needs such as food, clothing and shelter. ï Relative Poverty takes into consideration individual social and economic status compared to the rest of society.
- 5. Poverty Line ï the estimated minimum level of income needed to secure the necessities of life. ï First introduced in 1990, a dollar a day poverty line measured absolute poverty by the standards of the worldâs poorest countries. ï The World Bank defined the new international poverty line as $1.25 a day in 2008 ï In October 2015, they reset it to $1.90 a day.
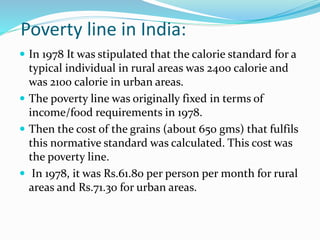
- 6. Poverty line in India: ï In 1978 It was stipulated that the calorie standard for a typical individual in rural areas was 2400 calorie and was 2100 calorie in urban areas. ï The poverty line was originally fixed in terms of income/food requirements in 1978. ï Then the cost of the grains (about 650 gms) that fulfils this normative standard was calculated. This cost was the poverty line. ï In 1978, it was Rs.61.80 per person per month for rural areas and Rs.71.30 for urban areas.
- 7. Calorie Distribution in India 0 500 1000 1500 2000 2500 3000 3500 4000 Required Calories Received Calories Rural Poor Rural Wealthy Urban Poor Urban Wealthy
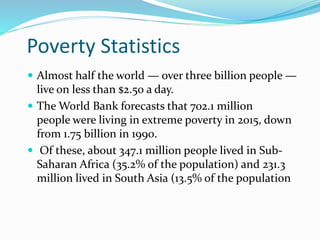
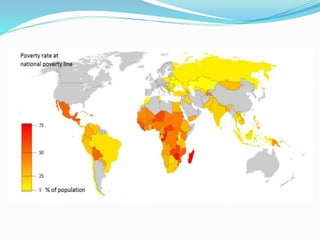
- 8. Poverty Statistics ï Almost half the world â over three billion people â live on less than $2.50 a day. ï The World Bank forecasts that 702.1 million people were living in extreme poverty in 2015, down from 1.75 billion in 1990. ï Of these, about 347.1 million people lived in Sub- Saharan Africa (35.2% of the population) and 231.3 million lived in South Asia (13.5% of the population
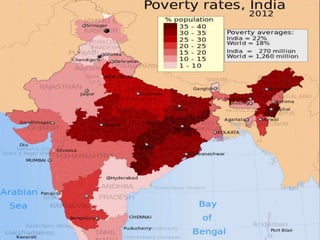
- 10. Poverty in Indian States ï India has the worldâs largest number of poor people in a single country ï More than 75% of poor people reside in villages ï The poverty level is below 10% in states like Delhi, Goa, and Punjab etc ï whereas it is below 50% in Bihar (43) and Orissa (47). It is between 30-40% in Northeastern states of Assam, Tripura, and Meghalaya and in Southern states of Tamil Nadu and Uttar Pradesh.
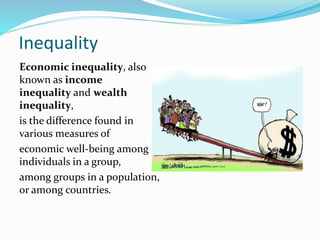
- 12. Inequality Economic inequality, also known as income inequality and wealth inequality, is the difference found in various measures of economic well-being among individuals in a group, among groups in a population, or among countries.
- 13. Causes of Economic Inequality (i) Wages are determined by labor market (ii) Education affects wages (iii) Growth in technology widens income gap (iv) Gender does matter (v) Personal factors
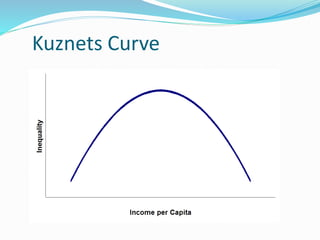
- 14. Kuznets Curve
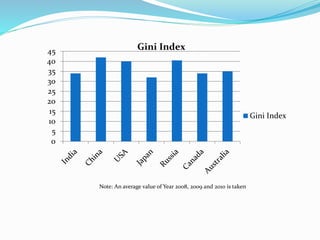
- 15. Gini Coefficient ï The most popular measure of inequality is the Gini coefficient. ï If all individuals have the same consumption (or income), then the Gini has a value of 0, perfect equality. ï If one individual has all the consumption, the Gini has a value of 1 , perfect inequality.
- 16. Note: An average value of Year 2008, 2009 and 2010 is taken 0 5 10 15 20 25 30 35 40 45 Gini Index Gini Index
- 18. Inequality in India ï 2004-05 to 2011-12 Gini Index Rural : .26 to .28 Urban: .35 to .38 ï Inequality has been on the rise since 1990âs 29 30 31 32 33 34 35 1990 1995 2000 2005 2010 Gini Index Gini Index
- 20. Thank You


