Power BI Desktop Overview
•Download as PPTX, PDF•
0 likes•78 views

Power BI is a suite of business analytics tools businesses use for analyzing data and sharing insights. Power BI dashboards provide a 360-degree view for business users with their most important metrics in one place, updated in real-time, and available on all devices. In this session, you will learn to use Microsoft Power BI (Business Intelligence) to develop reports. This is an introductory overview of Power BI to get you started. Sign up for a free webinar at nrclc.eventbrite.com


Power BI Desktop Overview
- 1. Dr. Vazi Okhandiar, DBA, MSCS, PMP, MCT www.nrclc.com. (714) 505-3475 Build a Dashboard Using Microsoft Power BI NR Computer Learning Center
- 2. NR Computer Learning Center (NRCLC) •Established in 2002 •Provide Computer Training •Microsoft Partner  Hands-on classroom training  Online Training  Virtual Live Training  Private Lesson
- 3. Dr. Vazi Okhandiar Over 30 years of teaching experience in Computer Science & IT courses and Microsoft Products. Worked for the World Bank, General Motors, HP/EDS, Toyota, CSC, Olympus, and Mitsubishi, as well as numerous small and medium-sized enterprises. Education: • DBA, Walden University • MBA, University of California, Irvine • Masters in Computer Science, Illinois Institute of Technology, Chicago • Bachelor’s Degree in Electrical Engineering, University of California, Irvine. Microsoft Certified Trainer (MCT) by Microsoft and Certified Project Management Professional (PMP) by PMI
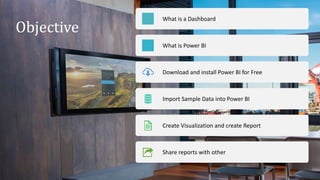
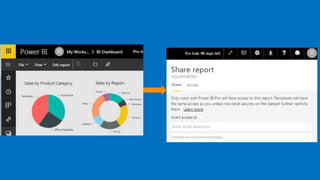
- 4. Objective What is a Dashboard What is Power BI Download and install Power BI for Free Import Sample Data into Power BI Create Visualization and create Report Share reports with other
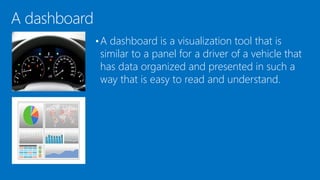
- 5. A dashboard •A dashboard is a visualization tool that is similar to a panel for a driver of a vehicle that has data organized and presented in such a way that is easy to read and understand.
- 6. Executive Dashboard • An Executive Dashboard is a visual representation that gives executives a quick and easy way to view their company’s performance in real-time. • The Executive Dashboard pulls the information from various data sources into one place for data analysis.
- 7. Benefit of Digital Dashboards • Visual presentation of performance measures • Ability to identify efficiencies/inefficiencies • Ability to identify and correct negative trends • Ability to identify new trends. • Ability to make more informed decision • Align strategies and organizational goals • Increase overall revenue
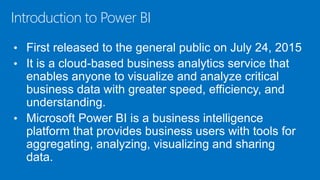
- 8. Introduction to Power BI • First released to the general public on July 24, 2015 • It is a cloud-based business analytics service that enables anyone to visualize and analyze critical business data with greater speed, efficiency, and understanding. • Microsoft Power BI is a business intelligence platform that provides business users with tools for aggregating, analyzing, visualizing and sharing data.
- 9. Who uses Power BI • Analysts • Business Users • IT Professional • Developers
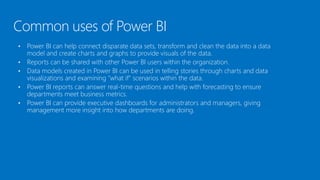
- 10. Common uses of Power BI • Power BI can help connect disparate data sets, transform and clean the data into a data model and create charts and graphs to provide visuals of the data. • Reports can be shared with other Power BI users within the organization. • Data models created in Power BI can be used in telling stories through charts and data visualizations and examining "what if" scenarios within the data. • Power BI reports can answer real-time questions and help with forecasting to ensure departments meet business metrics. • Power BI can provide executive dashboards for administrators and managers, giving management more insight into how departments are doing.
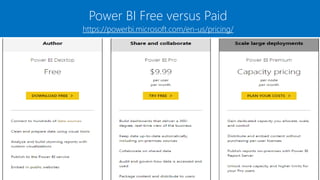
- 12. Power BI Free versus Paid https://powerbi.microsoft.com/en-us/pricing/
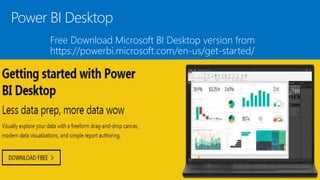
- 13. Power BI Desktop Free Download Microsoft BI Desktop version from https://powerbi.microsoft.com/en-us/get-started/
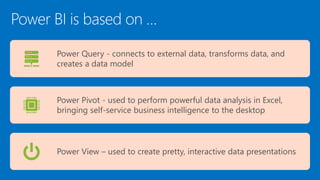
- 14. Power BI is based on … Power Query - connects to external data, transforms data, and creates a data model Power Pivot - used to perform powerful data analysis in Excel, bringing self-service business intelligence to the desktop Power View – used to create pretty, interactive data presentations
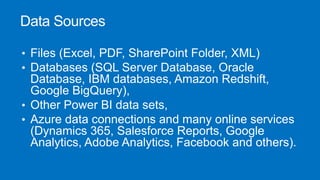
- 15. Data Sources • Files (Excel, PDF, SharePoint Folder, XML) • Databases (SQL Server Database, Oracle Database, IBM databases, Amazon Redshift, Google BigQuery), • Other Power BI data sets, • Azure data connections and many online services (Dynamics 365, Salesforce Reports, Google Analytics, Adobe Analytics, Facebook and others).
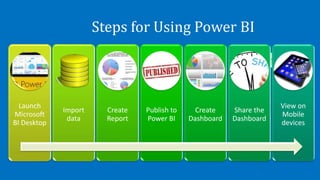
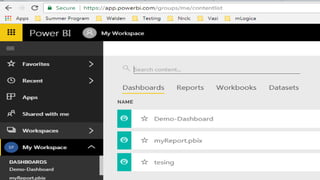
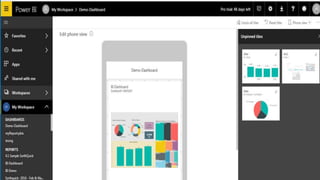
- 16. Steps for Using Power BI Launch Microsoft BI Desktop Import data Create Report Publish to Power BI Create Dashboard Share the Dashboard View on Mobile devices
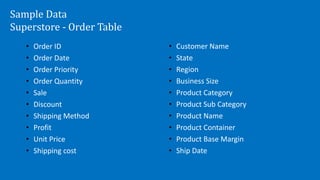
- 17. Sample Data Superstore - Order Table • Order ID • Order Date • Order Priority • Order Quantity • Sale • Discount • Shipping Method • Profit • Unit Price • Shipping cost • Customer Name • State • Region • Business Size • Product Category • Product Sub Category • Product Name • Product Container • Product Base Margin • Ship Date
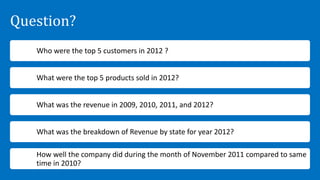
- 18. Question? Who were the top 5 customers in 2012 ? What were the top 5 products sold in 2012? What was the revenue in 2009, 2010, 2011, and 2012? What was the breakdown of Revenue by state for year 2012? How well the company did during the month of November 2011 compared to same time in 2010?
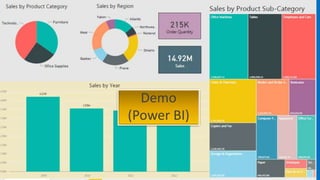
- 19. Demo (Power BI)
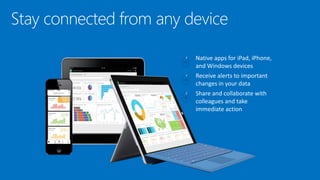
- 24. Stay connected from any device
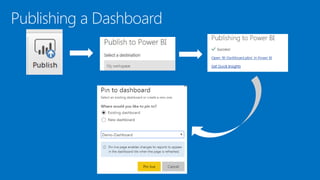
- 25. Summary Topic covered: • Importing data • Developing Dashboard with Power BI • Publishing a Dashboard
- 26. Live Instructor Led Online Training • Microsoft Power BI for Data Analyst (2 Days) • Analyzing Data with Self-Service BI • Connecting to Data Sources • Performing Data Cleaning, Profiling, and Shaping • Visualizing Data with Power BI • Enhancing Data Analysis • Modeling Data with Calculations • Creating Interactive Visualizations • Prerequires • Microsoft Excel 2019 – Intermediate • Optional: Experience with other data analytics tools, such as Google Analytics as well as an understanding of database design or SQL language