Powering Up Writing Grant Report
ŌĆó
1 likeŌĆó311 views

The document reports on a study evaluating a writing workshop program implemented in schools. It found that the program was associated with improved student writing proficiency on standardized tests. Data tables show increases in test scores and the number of students meeting targets from the first to second year of implementation. The program also appeared to help close an achievement gap between boys and girls. Overall, the conclusions were that teacher training and alignment of the writing curriculum to standards can positively impact student writing outcomes.


Powering Up Writing Grant Report
- 1. Inspired Writing Powering Up the WriterŌĆÖs Workshop Grant EvaluatorŌĆÖs Final Report LPS Board of Education January 28, 2010
- 2. Agenda Vision & Context Data & Results Professional Development Conclusions
- 4. Data & Results LoriŌĆÖs vita here
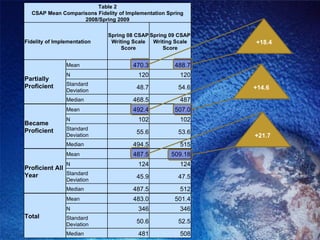
- 5. Table 2 CSAP Mean Comparisons Fidelity of Implementation Spring 2008/Spring 2009 Fidelity of Implementation Spring 08 CSAP Writing Scale Score Spring 09 CSAP Writing Scale Score Partially Proficient Mean 470.3 488.7 N 120 120 Standard Deviation 48.7 54.6 Median 468.5 487 Became Proficient Mean 492.4 507.0 N 102 102 Standard Deviation 55.6 53.6 Median 494.5 515 Proficient All Year Mean 487.5 509.18 N 124 124 Standard Deviation 45.9 47.5 Median 487.5 512 Total Mean 483.0 501.4 N 346 346 Standard Deviation 50.6 52.5 Median 481 508 +18.4 +14.6 +21.7
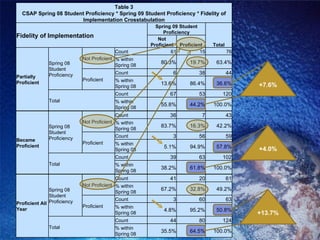
- 6. Table 3 CSAP Spring 08 Student Proficiency * Spring 09 Student Proficiency * Fidelity of Implementation Crosstabulation Fidelity of Implementation Spring 09 Student Proficiency Total Not Proficient Proficient Partially Proficient Spring 08 Student Proficiency Not Proficient Count 61 15 76 % within Spring 08 80.3% 19.7% 63.4% Proficient Count 6 38 44 % within Spring 08 13.6% 86.4% 36.6% Total Count 67 53 120 % within Spring 08 55.8% 44.2% 100.0% Became Proficient Spring 08 Student Proficiency Not Proficient Count 36 7 43 % within Spring 08 83.7% 16.3% 42.2% Proficient Count 3 56 59 % within Spring 08 5.1% 94.9% 57.8% Total Count 39 63 102 % within Spring 08 38.2% 61.8% 100.0% Proficient All Year Spring 08 Student Proficiency Not Proficient Count 41 20 61 % within Spring 08 67.2% 32.8% 49.2% Proficient Count 3 60 63 % within Spring 08 4.8% 95.2% 50.8% Total Count 44 80 124 % within Spring 08 35.5% 64.5% 100.0% +7.6% +4.0% +13.7%
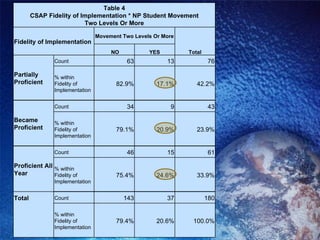
- 7. Table 4 CSAP Fidelity of Implementation * NP Student Movement Two Levels Or More Fidelity of Implementation Movement Two Levels Or More Total NO YES Partially Proficient Count 63 13 76 % within Fidelity of Implementation 82.9% 17.1% 42.2% Became Proficient Count 34 9 43 % within Fidelity of Implementation 79.1% 20.9% 23.9% Proficient All Year Count 46 15 61 % within Fidelity of Implementation 75.4% 24.6% 33.9% Total Count 143 37 180 ┬Ā % within Fidelity of Implementation 79.4% 20.6% 100.0%
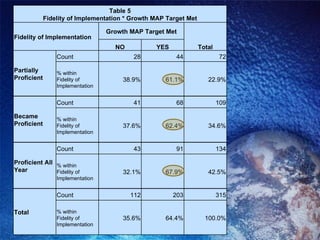
- 8. Table 5 Fidelity of Implementation * Growth MAP Target Met Fidelity of Implementation Growth MAP Target Met Total NO YES Partially Proficient Count 28 44 72 % within Fidelity of Implementation 38.9% 61.1% 22.9% Became Proficient Count 41 68 109 % within Fidelity of Implementation 37.6% 62.4% 34.6% Proficient All Year Count 43 91 134 % within Fidelity of Implementation 32.1% 67.9% 42.5% Total Count 112 203 315 % within Fidelity of Implementation 35.6% 64.4% 100.0%
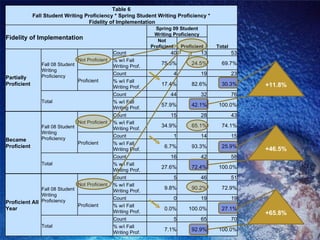
- 9. Table 6 Fall Student Writing Proficiency * Spring Student Writing Proficiency * Fidelity of Implementation Fidelity of Implementation Spring 09 Student Writing Proficiency Total Not Proficient Proficient Partially Proficient Fall 08 Student Writing Proficiency Not Proficient Count 40 13 53 % w/i Fall Writing Prof. 75.5% 24.5% 69.7% Proficient Count 4 19 23 % w/i Fall Writing Prof. 17.4% 82.6% 30.3% Total Count 44 32 76 % w/i Fall Writing Prof. 57.9% 42.1% 100.0% Became Proficient Fall 08 Student Writing Proficiency Not Proficient Count 15 28 43 % w/i Fall Writing Prof. 34.9% 65.1% 74.1% Proficient Count 1 14 15 % w/i Fall Writing Prof. 6.7% 93.3% 25.9% Total Count 16 42 58 % w/i Fall Writing Prof. 27.6% 72.4% 100.0% Proficient All Year Fall 08 Student Writing Proficiency Not Proficient Count 5 46 51 % w/i Fall Writing Prof. 9.8% 90.2% 72.9% Proficient Count 0 19 19 % w/i Fall Writing Prof. 0.0% 100.0% 27.1% Total Count 5 65 70 % w/i Fall Writing Prof. 7.1% 92.9% 100.0% +11.8% +46.5% +65.8%
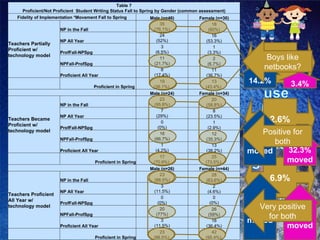
- 10. Table 7 Proficient/Not Proficient Student Writing Status Fall to Spring by Gender (common assessment) Fidelity of Implementation *Movement Fall to Spring Male (n=46) Female (n=30) Teachers Partially Proficient w/ technology model NP in the Fall 35 (76.1%) 18 (60%) NP All Year 24 (52%) 16 (53.3%) ProfFall-NPSpg 3 (6.5%) 1 (3.3%) NPFall-ProfSpg 11 (21.7%) 2 (6.7%) Proficient All Year 8 (17.4%) 11 (36.7%) ┬Ā Proficient in Spring 19 (38.1%)┬Ā 13 (43.4%)┬Ā ┬Ā Male (n=24) Female (n=34) Teachers Became Proficient w/ technology model NP in the Fall 23 (95.8%) 20 (58.8%) NP All Year 7 (29%) 8 (23.5%) ProfFall-NPSpg 0 (0%) 1 (2.9%) NPFall-ProfSpg 16 (66.7%) 12 (35.3%) Proficient All Year 1 (4.2%) 13 (38.2%) ┬Ā Proficient in Spring 17 (70.9%)┬Ā 25 (73.5%)┬Ā ┬Ā Male (n=26) Female (n=44) Teachers Proficient All Year w/ technology model NP in the Fall 23 (88.5%) 28 (63.6%) NP All Year 3 (11.5%) 2 (4.6%) ProfFall-NPSpg 0 (0%) 0 (0%) NPFall-ProfSpg 20 (77%) 26 (59%) Proficient All Year 3 (11.5%) 16 (36.4%) Proficient in Spring 23 (88.5%)┬Ā 42 (95.4%)┬Ā 16.1% 37.0% 24.9% 5.3% 2.6% 6.9% 3.4% 14.2% 32.3% moved 66.7% moved 77% moved 59% moved Boys like netbooks? Positive for both Very positive for both
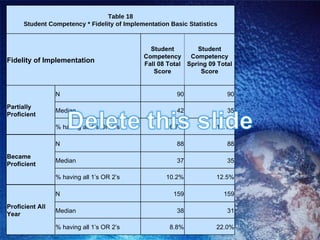
- 11. Table 18 Student Competency * Fidelity of Implementation Basic Statistics Fidelity of Implementation Student Competency Fall 08 Total Score Student Competency Spring 09 Total Score Partially Proficient N 90 90 Median 42 35 % having all 1ŌĆÖs OR 2ŌĆÖs 6.7% 11.1% Became Proficient N 88 88 Median 37 35 % having all 1ŌĆÖs OR 2ŌĆÖs 10.2% 12.5% Proficient All Year N 159 159 Median 38 31 % having all 1ŌĆÖs OR 2ŌĆÖs 8.8% 22.0%
- 12. Table 20 Teacher Competency Total Score * Fidelity of Implementation Basic Statistics Fidelity of Implementation Teacher Competency Fall 08 Total Score Teacher Competency Spring 09 Total Score Partially Proficient N 5 5 Median 33 28 Minimum 27 19 Maximum 37 33 Became Proficient N 6 6 Median 30.5 23 Minimum 23 21 Maximum 35 30 Proficient All Year N 5 5 Median 29 21 Minimum 21 20 Maximum 40 27
- 13. Professional Development Tell the competency story here with two to four bullets
- 14. Lessons Learned: Do not overestimate our teachersŌĆ” Do not underestimate our teachersŌĆ” Differentiation mattersŌĆ” Alignment makes the difference
- 15. Conclusions Teachers owned the project Student achievement was accelerated Curriculum alignment was strong Boys closed gaps Model is scalable
- 16. ŌĆ£ Through writing, we are.ŌĆØ -Kathleen Yancey, NCTE Past-President Inspired Learning
Editor's Notes
- #2: Mollie McDonald, Mike Porter and Lori Nebelsick-Gullett to the speakerŌĆÖs table
- #3: Dan Maas will introduce the agenda for the discussion item to the Board
- #4: This is the report contracted for the CDE grant ŌĆ£Powering Up the WriterŌĆÖs Workshop.ŌĆØ We outlined some of our own thoughts back in the fall. These data to be presented here are from the official report from the independent evaluator. The project was to use netbooks with ten 5 th grades in LPS and Englewood.
- #5: Have Lori introduce herself and outline her experience and qualifications. (2 min)
- #6: Dan: We will present a selection of tables from the report that has been provided to you. This one shows the raw scores on CSAP for the cohort of students in the pilot. The 2008 CSAP represents their scores in 4 th grade and the 2009 CSAP are the scores from 5 th grade. Lori: The first thing to note is the column down the left side which denotes the teacher proficiency rating. In research, we call this ŌĆ£fidelityŌĆØ and by that we mean how well teachers were able to adopt and implement the models of instruction proposed in the project. I think it is important to note that none of the teachers from either district scored as ŌĆ£not proficientŌĆØ by the end of the year. [is this common in your experience?] Dan: If we look at the change in the results (click to animate) we can see that gains were made and that somewhat larger gains were made by teachers who were proficient all yearŌĆ” that is, they were good at using the netbooks in their instructional model, the WriterŌĆÖs Workshop, throughout the year. But these differences are not significant and so we should be careful not to draw conclusion too quickly. But what should be noted is that the training for this project did not wrap up until one month before the administration of CSAP. As such, one would not expect to see any real gains so soon. So in that context, these results are at least interesting.
- #7: Dan: When we look into breakout comparisons, we start to see a richer story. (click) First, letŌĆÖs look at the change in CSAP writing proficiency rates from 2008 to 2009. These numbers represent both districts. Note that gains are made for all three groups, but that the ŌĆ£proficient all yearŌĆØ group had much bigger gains that the other two. (Click) Next, look at the values for students who were proficient in 2008 but slipped backward in 2009. The more proficient teachers had better results at keeping kids from sliding out of proficiency from 4 th to 5 th grades. (Click) But perhaps the most interesting data on this table is the catching up data where students who were not proficient in 2008 and became proficient in 2009. All three groups moved kids forward, but the ŌĆ£proficient all yearŌĆØ group moved almost twice as many kids into proficiency as the other two groups. This bodes well for this yearŌĆÖs results as the teachers who became proficient in using netbooks will be proficient all year in 2009-2010. Lori: Additional note?
- #8: Dan: This is another view into the CSAP data. Each score of proficiency has 3 levelsŌĆ” a high, medium and low. To detect how students move within the proficiency bands, we can look at whether students are moving across two or more levels which would indicate very large changes. The percentage of students crossing 2 or more levels does increase with teacher proficiency. Lori: Note?
- #9: Dan: Here is a look at Fall to Spring Map data and the percentage of students hitting growth targets. You can see that there is higher percentage of hitting targets for the more proficient teachers. Lori: Note?
- #10: Dan: This is perhaps the most telling data we received from the evaluator. This is a pre and post test completed in the Littleton schools. Englewood data is not represented here. Our 5 schools used a common assessment and a CSAP aligned scoring rubric for these results. While CSAP will only measure the standards and MAP will only measure some components necessary for writing, this test represents the most in-depth measure of what the curriculum calls for in LPS. (Click) Again, weŌĆÖll start with the change in proficiency rates from the Fall ŌĆś08 assessment to the Spring ŌĆÖ09. Here, you see stark differences in the groups. While all three show gains, the students working with more proficient teachers drastically outpace their peers in demonstrating writing proficiency. (Click) Now look at the ŌĆ£fall backŌĆØ group and you can see markedly less slipping for teachers who have gained proficiencyŌĆ” and the teachers that were proficient all year showed no slipping at all! (Click) But the coup is in the movement of kids from not proficient in the Fall to Proficient in the Spring. Here, you can see that the proficiency with the model of using netbooks in the writerŌĆÖs workshop process drastically improves the gains for students with the ŌĆ£proficient all yearŌĆØ group moving over 90% of their non-proficient kids into proficiency by the end of the year. Lori: Note?
- #11: Dan: Another important aspect of this research is to look at the impact on the gap that exists between boys and girls in writing. Most of our school improvement plans address an equity goal around helping boys close the gap with the girls in their peer group. (Click) First, note the gains made by boys for the partially proficient teachers. While the girls have little effect, the effect on boys is noticeable. This may be attributable to boys having more interest in composing by netbooks rather than by pencil. While the teacherŌĆÖs skill may be weaker, the very presence of the netbooks may be inviting more boys to engage in writing thus improving some of their skills by virtue of more time on task. To make this conclusion, would require more study, but this seems to be a reasonable hypothesis. As teacher proficiency improves, the effect on girls becomes much better but the effect is again still larger for the boysŌĆ” And with teachers proficient all year, the girls show very big gains, but the effect is still greater for the boys. Clearly, the boys are closing the gap. (Click) Note the Spring proficiency for boys and girls for teachers who are proficient in this model all yearŌĆ” right on target for the 90% goal! Lori: Note?
- #14: Mike:
- #15: Mike:
- #16: Dan: After reviewing the data presented by our evaluator, I believe we can make the following conclusions. Our teachers did embrace this effort as evidenced by none of them remaining at a ŌĆ£not proficientŌĆØ status by the end of the pilot period. Looking at many angles on student achievement, the effect was positive even in the CSAP administered so soon after the final teacher trainings. The use of netbooks was not really the planŌĆ” it was about using netbooks in a WriterŌĆÖs Workshop model and that makes our project different from most other laptop projects you might read about. It is exciting to see affirmation of what teachers have been telling us for yearsŌĆ” boys donŌĆÖt like to write with pencils but they will write with computers. This shows strong signs of closing the writing achievement gap for boys. And we believe this model to continue to be scalable. As you know, we have implemented 1,800 more netbooks in all 5 th grades, 6 th grade and 9 th grade language arts and we have successfully completed training of simliar or higher quality than we achieved in the pilot.
- #17: Dan: At this point, we would like to field your questions. Our evaluator is here to help further explain any of the data I have touched upon. Also, Mike Porter and Mollie McDonald can answer questions on training and instruction methods for the effort. Thank you