狠狠撸

狠狠撸Share a Scribd company logo
Economics 102: Introduction to
Microeconomics
Microeconomics: The study of how resources are
allocated to various uses in society.
Each society must answer the following three
questions:
Q1: What to produce?
Q2: How to produce it?
Q3: For whom do we produce it?
Economic Efficiency
An economy, or economic process, is operating efficiently
if it cannot make more of one good without making less
of another.
Opportunity Cost
The quantity of a good we must sacrifice to obtain
one more unit of some other good.
Economic Models
Models are simplified representations of reality, used
to study and understand relationships in the real world.
Models are, by nature, abstractions. The trick is choosing
the correct level of abstraction.
Most economic models are built with mathematics; graphs
and equations.
Example: A simplified economy with
limited resources for production.
Resource: 100 workers who can pick berries or catch fish.
50 nets for collecting fish or berries.
The available technology:
Workers [W]: 1 W => 1 bushel of berries per day
or
1 W => 1 pound of fish per day
Nets [N]: 1 N => 1/2 bushel of berries per day
or
1 N => 2 pounds of fish per day
If all of our resources were used to produce fish:
100W*[1 pound per day/W]+50N*[2 bushel per day/N]
=> 200 pounds of fish per day
If all of our resources were used to produce berries:
100W*[1 bushel per day/W]+50N*[1/2 bushel per day/N]
=> 125 bushels of berries per day
We would like to know all the possible combinations of fish
and berries our society can produce.
As we transfer resources from fish production to berry production,
we will transfer the least productive fish producers first.
In our example, this means we will transfer workers first.
We will continue transferring workers until only workers are picking
berries and all nets are being used to catch fish.
If we want still more berries, we must shift nets from fish production
to berry production. The terms of the trade-off of fish for berries
will worsen.
When we transfer a worker from fish to berry production:
We give up one pound of fish and we gain one additional bushel of berries.
This implies that 1 pound of fish = one pound of berries.
When we transfer a net from fish to berry production:
We give up two pounds of fish and we gain 1/2 additional bushel of berries.
This implies that 4 pounds of fish = 1 bushel of berries
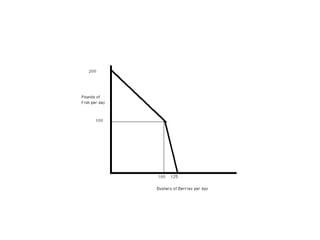
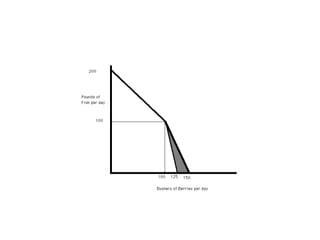
Production Possibilities Curve (PPC):
A graph of all economically efficient combinations of goods the society
is able to produce.
The changes in slope in the diagram tell us how the rate of exchange, or
rater of transformation of goods, between fish and berries changes as
we continue to transfer resources from one product to the other.
The Rate of Transformation on the PPC is the rate of economically
efficient exchange; it tells us the Opportunity Cost of one good in
terms of another.
ppc2.ppt
Rate of Transformation:
[Change in pounds of fish per day]/[Change in bushels of berries per day]
as we move along the PPC
In other words, it is the slope of the PPC.
On the upper part of the curve, the slope is -1
On the lower part of the curve, the slope is -4
The Rate of Transformation measures the amount of one good we must
sacrifice to get one unit of the other, or, the Opportunity Cost.
The Opportunity Cost of one bushel of berries is one pound of fish on the
upper part of the curve, and 4 pounds of fish on the lower part of the curve.
The PPC will shift outward:
? If additional productive resources are made
available.
? If current available resources become more
productive.
? If more productive ways of combining
resources are found.
Suppose our technology changes so that Nets become more
productive than they were previously.
The new technology is:
1 N => 1 bushel of berries per day [instead of 1/2 bushel/day
or
1 N => 2 pounds of fish per day [same as before]
ppc2.ppt
If the Rate of Transformation changes continuously along
the curve, then as we continue to transfer resources
from fish to berry production, each additional bushel of
berries will require a larger sacrifice of fish production
than the previous one.
Thus, berries become ‘more expensive’ in terms of fish
production as we make more and more of them.
The Opportunity Cost of berries continually increases,
so that each additional bushel requires a larger reduction
in pounds of fish produced.
More Related Content

Similar to ppc2.ppt (20)

PDF
4 5-basic economic concepts to pharmacy
University of Zambia, School of Pharmacy, Lusaka, Zambia
?
PPTX
狠狠撸s_Chapter 1.pptx
rygt7cp89y
?
PPT
Unit 1 review_session
Malcolm Harrison
?
PPTX
Introduction To Microeconomics - Class 12
AnjaliKaur3
?
PPT
1.5.ppt-Opportunity Cost Opportunity Cost and Individual Decisions Production...
ShuchiGoel11
?
PPTX
Chapter 2 Microeconomics
Meghan Fernandez
?
PPT
Chapter1introductionwithoutgraph
Harshitbhesaniya
?
PPTX
L4 Understanding Economy.pptx
AmanGoyal963414
?
PPT
What is - Production Possibility (1).ppt
Dranupama2
?
PPT
Production possibility
Faith Martin
?
PPT
The Economic Problem: Scarcity and Choice
Noel Buensuceso
?
PPT
Intro lecture
Bhupendra Bule
?
PDF
Econ ppt1
potassium2012
?
PPT
Resource utilization.2015
Peter DeLuca
?
PPT
microeconomics, chapter 01 explain the introduction of microeconomics
nosabi8767
?
PPTX
The Basics of Economics
FarnazSha2
?
PPTX
Ma ch 02 economic tools and economic systems
Uconn Stamford
?
PPT
Introducing economics
Online
?
PPT
Introduction to agricultural economics
Debbie-Ann Hall
?
PDF
ECO chapter1 PPT.pdfoiihuhuhugygygygyggygy
esiyasmengesha
?
4 5-basic economic concepts to pharmacy
University of Zambia, School of Pharmacy, Lusaka, Zambia
?
狠狠撸s_Chapter 1.pptx
rygt7cp89y
?
Unit 1 review_session
Malcolm Harrison
?
Introduction To Microeconomics - Class 12
AnjaliKaur3
?
1.5.ppt-Opportunity Cost Opportunity Cost and Individual Decisions Production...
ShuchiGoel11
?
Chapter 2 Microeconomics
Meghan Fernandez
?
Chapter1introductionwithoutgraph
Harshitbhesaniya
?
L4 Understanding Economy.pptx
AmanGoyal963414
?
What is - Production Possibility (1).ppt
Dranupama2
?
Production possibility
Faith Martin
?
The Economic Problem: Scarcity and Choice
Noel Buensuceso
?
Intro lecture
Bhupendra Bule
?
Econ ppt1
potassium2012
?
Resource utilization.2015
Peter DeLuca
?
microeconomics, chapter 01 explain the introduction of microeconomics
nosabi8767
?
The Basics of Economics
FarnazSha2
?
Ma ch 02 economic tools and economic systems
Uconn Stamford
?
Introducing economics
Online
?
Introduction to agricultural economics
Debbie-Ann Hall
?
ECO chapter1 PPT.pdfoiihuhuhugygygygyggygy
esiyasmengesha
?

More from Dodong21 (10)

PPT
Chapter 1 (1).ppt
Dodong21
?
PPT
E145_Spr2010_Accounting_0.ppt
Dodong21
?
PPTX
basic-accounting-concepts-website.pptx
Dodong21
?
PPT
accountingbasics.ppt
Dodong21
?
PPT
Chapter 1.ppt
Dodong21
?
PPTX
2022-SGLG-MISOCC-PRESENTATION (1).pptx
Dodong21
?
PPTX
2022-SGLG-MISOCC-PRESENTATION.pptx
Dodong21
?
PPTX
Debunking Myths in Accounting An Introductory Class.pptx
Dodong21
?
PPTX
Implementation-of-the-Supreme-Court-Decision-in-the-Mandanas-Case.pptx
Dodong21
?
PPTX
PANDAC, Johnric P., JD1B_Functional Perspective.pptx
Dodong21
?
Chapter 1 (1).ppt
Dodong21
?
E145_Spr2010_Accounting_0.ppt
Dodong21
?
basic-accounting-concepts-website.pptx
Dodong21
?
accountingbasics.ppt
Dodong21
?
Chapter 1.ppt
Dodong21
?
2022-SGLG-MISOCC-PRESENTATION (1).pptx
Dodong21
?
2022-SGLG-MISOCC-PRESENTATION.pptx
Dodong21
?
Debunking Myths in Accounting An Introductory Class.pptx
Dodong21
?
Implementation-of-the-Supreme-Court-Decision-in-the-Mandanas-Case.pptx
Dodong21
?
PANDAC, Johnric P., JD1B_Functional Perspective.pptx
Dodong21
?
Ad

Recently uploaded (20)

PDF
Gold Price Dynamic | September 2024 | 888
888
?
PPTX
Bahamas-Tourism-Template-slidesppt.net_.pptx
EldyLorenaMartnezRiv
?
PDF
Why In-House Bookkeeping Often Fails Small UAE Businesses.
GITPAC Consultancy
?
PPTX
M&A presentation: Finance Master for Dummies
MarioDucreux2
?
PDF
kjvgjkgkjgjkgkjgjkgjkgkjgkjgkjgjkgkjgkjgjk
MarkPReyes
?
PDF
The Social Media Effect - How Short-Form Music Videos Are Beneficial for Musi...
MusicInsuranceCompany
?
PPTX
原版新加坡新加坡国立大学毕业证(狈鲍厂毕业证书)如何办理
Taqyea
?
PDF
Behavioral Biases That Shape Your Investing Decisions.
Rohan Das
?
PDF
Finance Benchmarks Prophecy or Pretense Webinar Recap - Auxis Webinar
Auxis Consulting & Outsourcing
?
PDF
2025 Crypto Liquidity on CEXes | CoinGecko
CoinGecko Research
?
PDF
Argentina: Governance Under Disruption – Markets, Institutions, and Milei’s E...
Prayata Gutierrez
?
PDF
Saudi Arabia's Vision for the Minerals Value Chain
Ghazi Joseph Haddad
?
PPTX
Business Finance Quarter 111111111111 Quiz 1.pptx
ThessieManera1
?
PPTX
Prospects & Challenges of Doing Business in Nepal: Investment Opportunities, ...
Kshitiz Parajuli
?
PPTX
Intro - Basics of Cost and Mgt Acct Supplementary.pptx
BetsySeyoum
?
PDF
Think You Know Digital Transformation-Think Again!.pdf
Jasper Colin
?
PPT
Effective Branch Management Session 1 Changing Contours of Banking Customer S...
NarinderKumarBhasin
?
PDF
gds_sd_2013-09-30_mandiwana_ramakobya_en (1).pdf
ssuser08506b1
?
PPTX
201920 Hf YR Corp. Per & Way Forward- Jan22-2020.pptx
MOTI38
?
PDF
Adrien Matray - A Prominent Macroeconomist
Adrien Matray
?
Gold Price Dynamic | September 2024 | 888
888
?
Bahamas-Tourism-Template-slidesppt.net_.pptx
EldyLorenaMartnezRiv
?
Why In-House Bookkeeping Often Fails Small UAE Businesses.
GITPAC Consultancy
?
M&A presentation: Finance Master for Dummies
MarioDucreux2
?
kjvgjkgkjgjkgkjgjkgjkgkjgkjgkjgjkgkjgkjgjk
MarkPReyes
?
The Social Media Effect - How Short-Form Music Videos Are Beneficial for Musi...
MusicInsuranceCompany
?
原版新加坡新加坡国立大学毕业证(狈鲍厂毕业证书)如何办理
Taqyea
?
Behavioral Biases That Shape Your Investing Decisions.
Rohan Das
?
Finance Benchmarks Prophecy or Pretense Webinar Recap - Auxis Webinar
Auxis Consulting & Outsourcing
?
2025 Crypto Liquidity on CEXes | CoinGecko
CoinGecko Research
?
Argentina: Governance Under Disruption – Markets, Institutions, and Milei’s E...
Prayata Gutierrez
?
Saudi Arabia's Vision for the Minerals Value Chain
Ghazi Joseph Haddad
?
Business Finance Quarter 111111111111 Quiz 1.pptx
ThessieManera1
?
Prospects & Challenges of Doing Business in Nepal: Investment Opportunities, ...
Kshitiz Parajuli
?
Intro - Basics of Cost and Mgt Acct Supplementary.pptx
BetsySeyoum
?
Think You Know Digital Transformation-Think Again!.pdf
Jasper Colin
?
Effective Branch Management Session 1 Changing Contours of Banking Customer S...
NarinderKumarBhasin
?
gds_sd_2013-09-30_mandiwana_ramakobya_en (1).pdf
ssuser08506b1
?
201920 Hf YR Corp. Per & Way Forward- Jan22-2020.pptx
MOTI38
?
Adrien Matray - A Prominent Macroeconomist
Adrien Matray
?
Ad

ppc2.ppt

  • 1. Economics 102: Introduction to Microeconomics Microeconomics: The study of how resources are allocated to various uses in society. Each society must answer the following three questions: Q1: What to produce? Q2: How to produce it? Q3: For whom do we produce it?
  • 2. Economic Efficiency An economy, or economic process, is operating efficiently if it cannot make more of one good without making less of another.
  • 3. Opportunity Cost The quantity of a good we must sacrifice to obtain one more unit of some other good.
  • 4. Economic Models Models are simplified representations of reality, used to study and understand relationships in the real world. Models are, by nature, abstractions. The trick is choosing the correct level of abstraction. Most economic models are built with mathematics; graphs and equations.
  • 5. Example: A simplified economy with limited resources for production. Resource: 100 workers who can pick berries or catch fish. 50 nets for collecting fish or berries.
  • 6. The available technology: Workers [W]: 1 W => 1 bushel of berries per day or 1 W => 1 pound of fish per day Nets [N]: 1 N => 1/2 bushel of berries per day or 1 N => 2 pounds of fish per day
  • 7. If all of our resources were used to produce fish: 100W*[1 pound per day/W]+50N*[2 bushel per day/N] => 200 pounds of fish per day If all of our resources were used to produce berries: 100W*[1 bushel per day/W]+50N*[1/2 bushel per day/N] => 125 bushels of berries per day
  • 8. We would like to know all the possible combinations of fish and berries our society can produce. As we transfer resources from fish production to berry production, we will transfer the least productive fish producers first. In our example, this means we will transfer workers first. We will continue transferring workers until only workers are picking berries and all nets are being used to catch fish. If we want still more berries, we must shift nets from fish production to berry production. The terms of the trade-off of fish for berries will worsen.
  • 9. When we transfer a worker from fish to berry production: We give up one pound of fish and we gain one additional bushel of berries. This implies that 1 pound of fish = one pound of berries. When we transfer a net from fish to berry production: We give up two pounds of fish and we gain 1/2 additional bushel of berries. This implies that 4 pounds of fish = 1 bushel of berries
  • 10. Production Possibilities Curve (PPC): A graph of all economically efficient combinations of goods the society is able to produce. The changes in slope in the diagram tell us how the rate of exchange, or rater of transformation of goods, between fish and berries changes as we continue to transfer resources from one product to the other. The Rate of Transformation on the PPC is the rate of economically efficient exchange; it tells us the Opportunity Cost of one good in terms of another.
  • 12. Rate of Transformation: [Change in pounds of fish per day]/[Change in bushels of berries per day] as we move along the PPC In other words, it is the slope of the PPC. On the upper part of the curve, the slope is -1 On the lower part of the curve, the slope is -4 The Rate of Transformation measures the amount of one good we must sacrifice to get one unit of the other, or, the Opportunity Cost. The Opportunity Cost of one bushel of berries is one pound of fish on the upper part of the curve, and 4 pounds of fish on the lower part of the curve.
  • 13. The PPC will shift outward: ? If additional productive resources are made available. ? If current available resources become more productive. ? If more productive ways of combining resources are found.
  • 14. Suppose our technology changes so that Nets become more productive than they were previously. The new technology is: 1 N => 1 bushel of berries per day [instead of 1/2 bushel/day or 1 N => 2 pounds of fish per day [same as before]
  • 16. If the Rate of Transformation changes continuously along the curve, then as we continue to transfer resources from fish to berry production, each additional bushel of berries will require a larger sacrifice of fish production than the previous one. Thus, berries become ‘more expensive’ in terms of fish production as we make more and more of them. The Opportunity Cost of berries continually increases, so that each additional bushel requires a larger reduction in pounds of fish produced.