Ppt
- 1. CURRENT STATUS OF FOREST AND FOREST PRODUCTS IN INDIA
- 2. Forest ŌĆó ŌĆśA plant community predominantly of trees and other woody vegetation, usually with a closed canopyŌĆÖ. ’āśForest resources play an important role in the economy of any country. It is highly complex, changing environment made up of a living and non living things. ’āśBasis of Classification 1. Method of regeneration 2. Age 3. Composition 4. Object of management 5. Ownership and legal status 6. Growing stock.
- 3. Functions of Forests The functions of forest may broadly classified into following categories ŌĆó Protective Function ŌĆó Productive Function ŌĆó Regulative Function ŌĆó Accessory Function
- 4. Protective Functions ŌĆó Forest Provide protection against Soil erosion, Droughts, floods, noise, radiations Soil erosion FloodsSoil erosion Droughts
- 5. Productive Functions ŌĆó Forest Provide various products like, gum resins, medicines, Katha, honey, pulp, bamboo, timber, and fruits
- 6. Regulative Functions ŌĆó The Forest regulates the level of Oxygen and carbon dioxide in atmosphere. The forests also help in regulating temperature conditions
- 9. Accessory Function ŌĆó Forest provides aesthetics, habitat to various flora and fauna besides that it also has an recreational value.
- 10. Ecological Importance or uses of Forests ŌĆó Regulation of global climate and temperature ŌĆó Forest play a crucial role in regulation of global climate and temperature as forest cover absorb the solar radiations that would otherwise be reflected back into the atmosphere by bare surface of the earth. ŌĆó Transpiration of plants increases the atmosphere humidity which affects the rainfall, cools the atmosphere and thus regulate the hydrological cycle
- 11. Reduction of Global Warming ŌĆó The main green house gas co2 is used by forests for photosynthesis process the forest act as a sink for co2 there by reducing the green house effect due to co2
- 12. Production of Oxygen ŌĆó During Photosynthesis process forest releases oxygen a very important gas for human survival thereby are called as lungs of earth.
- 13. Conservation of Soil ŌĆó They prevent soil erosion by binding the soil particles tightly in their roots. They also reduce the velocity of wind and rain which are chief agents causing erosion
- 14. Improvement in fertility of Soil ŌĆó The fertility of soil increases due to humans formed by the decay of forest litter
- 15. Absorption of Noise ŌĆó Forest cover absorbs the noise and helps in preventing noise pollution
- 16. Absorption of air pollutants ŌĆó Forest absorbs many toxic gasses and air pollutants and can help in keeping air pure.
- 17. Economical Importance of Forest ŌĆó Timber: Wood used for commercial purposes like for making furniture and other items like boats, bridges and other day to day uses. ŌĆó Fuel Wood: The wood is used as fuel for cooking and other purposes by poor people. ŌĆó Raw material for wood based industries: forest provide raw material for various wood based industries like paper and pulp, sports goods, furniture, match boxes etc.
- 18. ŌĆó Food: Fruits, roots, leaves of plants and trees along with the meat of forest animals provide the food to the tribal people. ŌĆó Miscellaneous Products: Miscellaneous products like, resin, gums, oils, medicines, Katha, honey are provided by forests
- 19. Forest area in top ten country in 2010: Country Area in m ha Percentage (%) Russian Federation 809 30.1 Brazil 519 19.3 Canada 310 11.5 USA 304 11.3 China 206 7.6 Democratic Republic of the Congo 154 5.7 Australia 149 5.5 Indonesia 94 3.5 Sudan 69 2.57 India 68 2.53 Total 2,682 100 Source: Global Forest Resource Assessment, 2010.
- 20. Status of forests in India Total geographical area- 328.7mha. Total geographical area against world area- 2.47% Recommended forest area (as per NFP 1894)- 33% Current forest Cover- 23.81% (78.28mha) Forest cover against world forest area- 1% Class Area (km2) Percentage of geographic area Very dense forest 83,471 2.54 Moderately dense forest 320,736 9.76 Open forest 287,820 8.75 Total forest cover 692,027 21.05 Tree cover 90,844 2.76 Total forest and tree cover 7,82,871 23.81 Scrub 42,177 1.28 Non-forest 2,553,059 77.67 Total geographical area 3,287,263 100.00 Source: Forest Survey of India, 2011. Per Capita Area forest @ .064 ha ŌĆō About 10% of World Avg.
- 22. Source: Forest Survey of India, 2011.
- 23. Production and Consumption: The annual production of wood from forest 3.175 m cum Annual potential production of wood from TOF 42.77 m cum Annual estimated production of fuel-wood from forest 1.23 m tonnes Annual estimated production of fuel-wood from TOF 19.25m tonnes Annual consumption of wood in household construction and furniture, industrial construction and furniture and agriculture implements 48.00 m cum Total annual consumption of fuel-wood 216.42m tonnes Proportion of population using fuel-wood from forests 23% Total fodder consuming live-stock dependent partially or completely on forest 38.49% Adult cattle unit completely dependent on forest 22.63% Source: Forest Survey of India, 2011.
- 24. Growing stock ŌĆó Among the States/ UTs, the maximum growing stocks in forests is reported from Arunachal Pradesh (493 m cum) followed by Uttarakhand (460 m cum) and Chhattisgarh (334 m cum). Category Growing Stock (m cum) Forests 4498.73 TOF 1548.42 Total 6047.15 ŌĆó The mean annual increment (MAI) of IndiaŌĆÖs forests is assessed to be less than 0.5 m3/ha/year as against the world average of about 2 m3/ha/year. ŌĆó India has a notified forest area of 78.29 million hectares, comprising 39.99 m ha of reserved, 23.84 m ha of Protected and 13.64 m ha of Un-classed (unclassified) Forests.
- 25. Value of Removals from the Forests Parameters India The Total Value (in b. US $) 13.4 Per capita value (in US$) 11.008 Industrial Round-wood (in b. US $) 6.2 Wood-fuel (in b. US $) 7.0 NWFP (m. US$) 133 Total Forest Revenue (in m.US$) 341.8 Food and Agricultural Organization (FAO 2010)
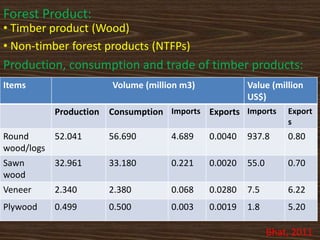
- 26. Forest Product: ŌĆó Timber product (Wood) ŌĆó Non-timber forest products (NTFPs) Production, consumption and trade of timber products: Items Volume (million m3) Value (million US$) Production Consumption Imports Exports Imports Export s Round wood/logs 52.041 56.690 4.689 0.0040 937.8 0.80 Sawn wood 32.961 33.180 0.221 0.0020 55.0 0.70 Veneer 2.340 2.380 0.068 0.0280 7.5 6.22 Plywood 0.499 0.500 0.003 0.0019 1.8 5.20 Bhat, 2011
- 27. WOOD PRODUCTION TRENDS IN SELECTED COUNTRIES Source: USAID
- 28. HOW MUCH WOOD ARE WE CONSUMING? Country/ region Wood stock per person/ in m3 Wood consumption/ person in m3 Timber m3/person Firewood m3/ person India 4.9 0.216 0.039 0.177 China 10.00 0.244 0.100 0.144 Japan 33.2 0.193 0.189 0.004 Asia 12.32 0.257 0.072 0.185 World 58.2 0.505 0.229 0.276 CTS Nair, 2013
- 29. Wood consumption in India INDIA FORESTRY OUTLOOK STUDY, APFSOS (MOEF), 2009
- 30. 1996 2001* 2006* Wood requirement (for housing, furniture, agricultural implements, industrial uses) 64 73 82 Output from natural forests 12 12 12 Output from plantations, social forestry schemes and other wood lots 41 47 53 Deficit 11 14 17 Demand and Supply of Wood ( million Cu.m) Source: FSI, 1996; *Estimated. Analysis: ŌĆó Supplies from natural forests and old plantations shall not increase from the current level of about 12 million cubic meters. It is likely that even this availability may decline in view of increasing restrictions on felling from forests. ŌĆó The deficit is estimated to increase, reaching a record 17 million cubic meters by 2006.
- 31. Demand and supply gap of various forest products Forest Products Demand (MT) Sustainable Supply (MT) Gap/Unsustaina ble Harvest (MT) Firewood 228 128 100 Fodder (green and dry) 1594 741 853 Timber 55 41 14 Source: Aggarwal et al, 2009 Analysis: ŌĆó With limited forest cover, the supply of forest products does not match the demand and hence there is a substantial gap. ŌĆó This gap often drives the over-exploitation of the forest.
- 32. India: Imports of Paper and Paperboard by Source, January-September 2012 Percent by Volume Which are the major suppliers of paper products to India?
- 33. Exports by Product Type 2001-2012 (Value)
- 35. Non-Timber Forest Product (NTFPs) : ŌĆó These includes bamboo, cane, grasses, oilseed, fibres, gums, and resin, dye, medicinal plants, spices, honey and wax, nut, sandalwood, leaves, seed for propagation. ŌĆó Contribute 60% of forest revenue, almost 40% of forest department revenues and 70% of forest exports income. ŌĆó 70% of NTFP collection in India take place in central ŌĆśtribal beltŌĆÖ of the country, in five states of Maharashtra, M.P, Bihar, Orissa, Andhra Pradesh.
- 36. SOUTH EAST ASIA - NTFPs TRADE (Source: NTFPŌĆÖs Annual Report, 2011) India 45% Philippines 22% Indonesia 24% Cambodia 9%
- 37. SOUTH EAST ASIA - NTFPs TRADE COUNTRY NUMBER OF ENTERPRISES NUMBER OF PERSONS INVOLVED NUMBER OF VILLAGES SALES India 27 2,232 370 Ōé¼1,81,596 Indonesia 29 1,452 58 Ōé¼ 99,838 Philippines 64 1,946 68 Ōé¼ 88,417.8 Cambodia 38 1,649 81 Ōé¼ 38,344.2 Total 163 7,400 600 Ōé¼4,08,196 (Source: NTFPŌĆÖs Annual Report, 2011)
- 38. Tendu Leaves (Diospyros melaoxylon. Lin) 70% of NTFP collection in India take place in central ŌĆśtribal beltŌĆÖ of the country, in states of Maharashtra, Madhya Pradesh, Chhattisgarh, Bihar, Orissa, Andhra Pradesh. ’āśTendu leaves trade in Chhattisgarh State: Collection season Collection rate (in Rs. Per S.B.) Estimate quantity (lakh std. bages) Collection quality (Lakh std. Bages) Collection wages (in Rs. Crores) Price (in Rs. Crores) Gain (in Rs. Crores) 2008 600 17.93 13.78 82.77 197.61 87.34 2009 650 17.93 14.67 95.33 256.41 120.75 2010 700 16.39 15.45 108.15 335.31 176.94 2011 800 16.39 13.57 108.52 355.31 198.22 2012 1100 16.40 17.15 188.66 646.90 389.63 ŌĆóSource:- status report of C.G. State NTFPs Cooperative limited 2012
- 39. Annual production of Tendu leaves in India: State 2008-09 2009-10 Weight (100 tons) Value (Crore Rs.) Weight (100 tons) Value (Crore Rs.) Arunachal Pradesh 4.06 0.27 1.60 0.10 Andhra Pradesh 310.80 56.18 327.00 54.41 Chhattisgarh 801.00 235.56 927.00 335.30 Gujarat 143.01 5.26 143.01 5.26 Jharkhand 339.00 43.44 340.80 15.26 Karnataka 3.86 0.70 3.42 0.57 Madhya Pradesh 1,197.00 262.99 1,204.2 264.57 Maharashtra 424.34 45.32 397.94 66.34 Odisha 415.12 301.79 403.07 326.49 Rajsthan 206.40 8.56 189 7.84 Uttar Pradesh 130.40 3.74 132.7 3.8 West Bengal 8.03 5.84 9.07 7.35 Total 3978.96 969.38 4,077.22 1,087.19 Forestry Statistics India (States Forest Report), 2011
- 40. Resin: Major resin producing states are Arunachal Pradesh, Himachal Pradesh, Jammu Kashmir, Uttarakhand in India. State 2008-09 2009-10 Weight(100 tons) Value (Crore Rs.) Weight(100 tons) Value (Crore Rs.) Arunachal Pradesh 4.06 0.27 1.60 0.10 Himachal Pradesh 75.96 39.88 65.00 45.50 Jammu Kashmir 24.42 13.29 16.93 8.31 Uttarakhand 187.52 30.81 196.08 54.57 Total 291.96 84.24 279.61 108.48 Forestry Statistics India (States Forest Report), 2011
- 41. TOP HONEY PRODUCING COUNTRIES IN THE WORLD (Source: FAO, 2011) 0 50000 100000 150000 200000 250000 300000 350000 400000 450000 Top production - Natural Honey - 2009 Production(mt)
- 42. Lac production at National level (Source: Indian Institute of Natural Resins and Gums[Report], Ranchi - 2011) 0 5000 10000 15000 20000 25000 2007-08 2008-09 2009-10 2010-11 20640 17175 16495 9035 Lac Production in (tons)
- 43. Share of different states in Lac production at National level (Source: Indian Institute of Natural Resins and Gums[Report], Ranchi - 2011) West Bengal 42.90% Chhattisgarh 29.60% Jharkhand 21.70% Maharashtra 4.90% Madhya Pradesh 0.80%
- 44. ŌĆ”ŌČ─”ŌČ─”ŌČ─”


![Lac production at National level
(Source: Indian Institute of Natural Resins and Gums[Report], Ranchi - 2011)
0
5000
10000
15000
20000
25000
2007-08 2008-09 2009-10 2010-11
20640
17175 16495
9035
Lac Production in (tons)](https://image.slidesharecdn.com/ppt-150706183727-lva1-app6892/85/Ppt-42-320.jpg)
![Share of different states in Lac production at
National level
(Source: Indian Institute of Natural Resins and Gums[Report], Ranchi - 2011)
West Bengal
42.90%
Chhattisgarh
29.60%
Jharkhand
21.70%
Maharashtra
4.90%
Madhya Pradesh
0.80%](https://image.slidesharecdn.com/ppt-150706183727-lva1-app6892/85/Ppt-43-320.jpg)
