Presentation of Data (thesis writing)
Download as PPTX, PDF9 likes2,385 views

This document discusses different methods for presenting data, including textual, tabular, and graphical presentation. Tabular presentation organizes data into rows and columns in a table. Textual presentation uses statements and numbers to describe data. Graphical presentation shows variations and relationships of data using visual formats like bar graphs, line graphs, and pie charts. Each method has advantages - tables provide concise information while graphs attract attention and enable quick comprehension of quantitative data relationships.
1 of 21
Downloaded 35 times


Recommended
Presentation of data
Presentation of dataWinona Esel Bernardo
╠²
Here are the class widths, marks and boundaries for the given class intervals:
a. Class interval (ci): 4 ŌĆō 8
Class Width: 4
Class Mark: 6
Class Boundary: 3.5 ŌĆō 8.5
b. Class interval (ci): 35 ŌĆō 44
Class Width: 9
Class Mark: 39.5
Class Boundary: 34.5 ŌĆō 43.5
c. Class interval (ci): 17 ŌĆō 21
Class Width: 4
Class Mark: 19
Class Boundary: 16.5 ŌĆō 20.5
d. Class interval (ci): 53 ŌĆō 57
Class Width: 4
Class Mark: 55
Class Boundary: 52.5 ŌĆōData presentation
Data presentationMaiBabes17
╠²
This document provides information on different ways to present data in scientific writing, including textual, tabular, and graphical formats. It discusses guidelines for each format, such as using concise language and referring readers to tables and figures in the textual format. For tables, it recommends limiting to relevant data, including units of measurement, and combining identical tables. Graphical formats should show trends or relationships clearly and avoid too many variables. The document also discusses writing the results section and interpreting common descriptive statistics.PRESENTATION OF DATA.pptx
PRESENTATION OF DATA.pptxLadeneDenila
╠²
Fghfxdfghufidkyy hxug ifididuoalsydudc fudtostsss5syup titiyoyxxjfkg kcjffif ifig kfifok f8fobicigobk ogifk lvvl kvobkcj isjsksjzjznsmensn sjsjsjjss jsjsns. Sksksjsbjwns s jwjwbspspsbosovbs snjshe e ebebdbs efjc bcoodeb dekoe oeorovd oeoovdidde ieviev d d rhfjcjj jvjjrnfedkekkdnedkdk wkksjsjdejjd ekksjsskebjjw jsksjsns snjsjsnsj skjsjejej keieishnsnsjeen qwwrrtyu iop asdf g hjkkl zxcvvbs nsmneiossjjdsj sjsjsksjsjsieisiei been snwn wnens nsnsn ddnjdbe dbhdbe e bdeb dbdb ebxhdbd dbdb dbdbe d xbjd dbxneb xbd d bden d xhdjdnd djdbnd e jdjdne. Djdjenbd xjdjejeje ejjene e jeje enejen ejdhd e nx. Dhdhe e ejdje djdbe jxdj d djd e dnjden djenns sjsjkseb djkdbsjsjshhe d jdjdbe snkdbden sjdjsnenebe. Sjdjene. Ejdjeb djdjendjejdjdjd ejjejejejen djjejejeje ejjeje pie power of your us asa ka happy birthday hope you have a great day langga hehehe Iloveyouuuu and amping ka diha po langga ha ha ha hehehe I can do that are important to me than I thought it would ensure that they are empowered scholar program and then I'll chat with her about it Presentation of data
Presentation of dataRuby Ocenar
╠²
Data can be presented in three methods: textual, tabular, or graphical. Tabular presentation involves organizing data into a table with columns and rows for classification. Graphical presentation uses visual representations like bar graphs, pie charts, and line graphs to show relationships between data points. Different types of graphs are suited to different types of data and comparisons.Lesson 26 presenting and interpreting data in tabular and graphical froms
Lesson 26 presenting and interpreting data in tabular and graphical fromsmjlobetos
╠²
This document discusses different methods for presenting data visually, including tabular, textual, and graphical forms. Tabular presentation organizes data in a table with clear headings and structure. Textual presentation describes data using words and numbers. Common graphical methods are line graphs to show trends over time, bar graphs to compare categories, and pie charts to illustrate proportions of a whole. Together, these visualization techniques help communicate findings from research studies.Chapter 4 - Research Parts Guide.pptx
Chapter 4 - Research Parts Guide.pptxGelmelinaLeaLepitenH
╠²
This chapter discusses the presentation, analysis, and interpretation of data collected for a study. Data should be presented clearly and logically using appropriate tables, graphs, and figures with clear titles and labeling. The analysis section should highlight only the most important findings relevant to the research questions. Interpretation involves establishing relationships between data and checking if findings support any hypotheses. Both quantitative and qualitative analysis can be used depending on the study. Graphs like bar graphs, pie charts, and line graphs are commonly used to visually represent data trends or relationships. Captions, labels, and other design elements of tables and figures should follow standard conventions for clear communication.Importance of Research
Importance of ResearchDianna Cuevas
╠²
The document discusses the importance and functions of research. It states that research corrects and expands perceptions by gathering new information on topics that are not well understood. Research also develops and evaluates concepts, practices, theories, and methods for testing these ideas. Additionally, research provides factual information to inform planning, decision-making, and evaluations for solving real-world problems related to issues like population growth, drug addiction, and crime. The document emphasizes that research is important for advancing human knowledge and improving life, and will continue to be relevant as long as people seek to expand their understanding of the world.Conceptual framework
Conceptual frameworkDepartment of Education
╠²
The document provides information about conceptual frameworks including:
- It defines a conceptual framework as a graphical presentation showing the key components and relationships in a research study.
- It discusses different purposes of conceptual frameworks such as showing the organization of a study and clarifying relationships between variables.
- It provides examples of common conceptual framework models including input-process-output, independent-dependent variable, and criterion-predictor models.Data collection and presentation
Data collection and presentationferdaus44
╠²
The document discusses various methods of collecting and presenting data. It describes primary and secondary data collection methods. Primary data is originally collected for a study, while secondary data has already been collected by others. Methods to collect primary data include direct investigation, questionnaires, and schedules. Secondary data can come from published reports. The document also discusses categorical and numerical data types and how to present each type. Categorical data can be presented in summary tables, bar charts, and pie charts. Numerical data presentation methods include frequency distributions, histograms, frequency polygons, and ogives.Thesis writing
Thesis writingCheldy S, Elumba-Pableo
╠²
Guidelines, format and sample on how to write a thesis for beginners. This includes the technical aspect in thesis writingData organization
Data organizationrowell balala
╠²
This document discusses different methods for organizing data in research. It describes data organization as the process of structuring collected factual information in a way that is accepted by the scientific community. Proper data organization is important for research because it allows facts to be represented in context and helps researchers answer questions and hypotheses. The document then explains three common ways to organize data: frequency distribution tables, stem-and-leaf diagrams, and different types of charts including bar charts, pie charts, line charts, and histograms. Guidelines are provided for constructing each of these data organization methods.Characteristics of Research
Characteristics of ResearchMakati Science High School
╠²
This document discusses the characteristics of good research and researchers. It provides 7 key characteristics of research: empirical, logical, cyclical, analytical, critical, methodical, and replicability. It also lists 5 qualities of a good researcher: intellectual curiosity, prudence, healthy criticism, intellectual honesty, and intellectual creativity. The document emphasizes that good research is based on direct experience, uses valid procedures, starts and ends with a problem, uses proven analytical methods, involves careful judgment, follows systematic methods, and can be replicated. Good researchers are curious, careful, open to criticism, honest, and creative in their work.Presentation of data mod 6
Presentation of data mod 6Winona Esel Bernardo
╠²
This document provides an overview of methods for presenting data, including textual, tabular, and graphical methods. It discusses topics such as ungrouped vs. grouped data, frequency distribution tables, stem-and-leaf plots, class boundaries, class midpoints, and class width. The objectives are to describe how to prepare a stem-and-leaf plot, describe data textually, construct a frequency distribution table, create graphs, and interpret graphs and tables. Examples are provided to illustrate these concepts and methods.DIAGRAMMATIC PRESENTATION OF DATA
DIAGRAMMATIC PRESENTATION OF DATAmohini yadav
╠²
This document discusses diagrammatic presentations of data, which use geometric techniques like bar diagrams, pie charts, and cartograms to visually present numerical information. The main advantages of these diagrams are that they are attractive, easy to remember and understand, simplify complex data, and help make comparisons. There are one-dimensional, two-dimensional, and three-dimensional diagrams. Examples provided include line graphs, bar graphs, sub-divided bar graphs, rectangular diagrams, and pie charts. Pie charts in particular can be used to show percentages and proportional relationships between parts of a whole.Review of Related Literature
Review of Related LiteratureJasper Obico
╠²
This document provides an overview of the research process and guidelines for reviewing related literature. It discusses the importance of reviewing related literature to avoid duplicating past studies and provide context for the research problem. The review of related literature should include recent, objective materials that are directly relevant to the study, such as findings, methods, and conclusions from past investigations. When writing the literature review, the researcher should paraphrase sources, cite authors, include only relevant information, and relate sources to the research topic. The review should have a logical flow and avoid lengthy quotes or a list-like format.DATA PROCESSING AND STATISTICAL TREATMENT
DATA PROCESSING AND STATISTICAL TREATMENTAdolf Odani
╠²
This document discusses various statistical concepts and techniques for data processing and analysis. It covers levels of measurement, descriptive statistics like frequency counts and percentages, averages, spreads, and inferential statistics including parametric tests like z-tests, t-tests, F-tests and non-parametric tests like chi-square. Correlation techniques such as Pearson product-moment correlation coefficient and Spearman rank-order correlation coefficient are also summarized. Common statistical tests for comparison including t-tests, F-tests, ANOVA, ANCOVA and chi-square are briefly explained.Presentation of Data
Presentation of DataUmair Anwar
╠²
presentation of data
Tabulated data can be easily understand and interpreted.
Graphical forms makes it possible to easily draw visual impression of data.
It makes comparisons easily.
This kind of method create an imprint on mind for a long period of time.
presentation of data
presentation of dataShafeek S
╠²
This document discusses different types of data and methods for presenting data. It describes qualitative and quantitative data, discrete and continuous data, and primary and secondary data. It also covers nominal and ordinal data. Common methods for presenting data include tabulation and various charts or diagrams. Tabulation involves organizing data into tables, following specific rules. Charts allow visualization of data and include bar charts, histograms, frequency polygons, cumulative frequency diagrams, scatter diagrams, line diagrams, and pie charts. Each chart has specific purposes and guidelines for effective presentation of data.Data presentation/ How to present Research outcome data
Data presentation/ How to present Research outcome dataDr-Jitendra Patel
╠²
In this power point viewer will be able to know about how to present data which is the out comes of any sincere research. The way of presentation is very very important because ultimately it should reach to the particular audience in proper and effective way.
In this PPT viewers will be able to know how to present data obtained as a result of any kind of Research. In report writing the information received need to reach to targeted audience and received data need to reflect in impressive and understandable manner therefore data presentation is very important.
portion covered
1. Data presentation
2. Textual data presentation
3. Tabular data presentation
4. Qualitative Tabular data presentation
5. Quantitative tabular data presentation
6. Temporal tabular data presentation
7. Spatial tabular data presentation
Causal comparative research
Causal comparative researchDua FaTima
╠²
Causal-comparative research attempts to identify cause-and-effect relationships by comparing two or more groups that differ on some independent variable. It is a nonexperimental method used to explore potential causes of existing differences between groups. Researchers select groups that already differ on the independent variable rather than manipulating the variable. Common threats to validity include lack of randomization and inability to control for confounding variables. Analysis typically involves comparing means and using t-tests or ANOVAs to determine if differences between groups are statistically significant.Introduction to statistics and graphical representation
Introduction to statistics and graphical representationAMNA BUTT
╠²
This document provides an introduction to statistics, including definitions and types. It discusses descriptive statistics, which deals with summarizing and describing numerical data through tables, graphs, and measures of center. Inferential statistics makes inferences about populations based on samples. The document also covers graphical representations in statistics, such as bar graphs, line graphs, pie charts, pictograms, and histograms, which visually display statistical data.Topic interpretation of data and its analysis
Topic interpretation of data and its analysisKmTriptiSingh
╠²
This document discusses interpretation and analysis of data in research. It defines interpretation as drawing inferences from collected facts after analysis to find broader meaning. Interpretation considers relationships within data and relates findings to other research. Effective interpretation requires considering all relevant factors and avoiding false generalizations. Data analysis organizes and models data to discover useful information for decision making. It distinguishes between quantitative data analyzed statistically and qualitative data analyzed through interviews, documents, and observation. Both interpretation and analysis are important for extracting meaningful insights from data.presentation of data
presentation of dataBritish Council
╠²
This document discusses various concepts related to data classification and frequency distribution. It defines classification as arranging data into categories based on common characteristics. The four main bases for classification are identified as qualitative, quantitative, geographical, and chronological. Types of classification include one-way, two-way, three-way, and many-way. Key aspects of forming a frequency distribution are discussed such as determining the class intervals, distributing raw data into classes, and calculating cumulative and relative frequencies.Chapter 4
Chapter 4Pauline Velarde
╠²
This chapter discusses the presentation, analysis, and interpretation of data collected for a research study. It provides guidelines for clearly presenting data through tables, figures, and charts. The data should be sufficient, valid, and accurately presented to answer the research questions. Both quantitative and qualitative analysis may be used depending on the type of data. Analysis involves describing patterns in the data and highlighting significant findings without making conclusions. Interpretation explains the implications of the findings and their connection to previous literature. Proper formatting and labeling of tables, graphs, and figures is also covered to effectively communicate the data.Statement of the problem (final)
Statement of the problem (final)Jerome Jardin
╠²
This document provides an outline for developing a research proposal. It includes sections for background information, defining the research problem, formulating objectives, selecting a research topic, and identifying variables and measurements. Sample questions are given to help formulate a clear research problem. The purpose is to guide the researcher in developing the key components of an empirical study, including subjects, test organisms, study location, and phenomenon. Target beneficiaries are identified. References are also included. The overall goal is to design a scientifically sound research proposal or study.Data analysis
Data analysisEko Priyanto
╠²
The document outlines the key components of findings, presentation, and discussion sections of a research study report. It notes that findings should present objective results through descriptive and inferential statistics. These findings are then discussed in a narrative, using tables and figures as needed, to explain their meaning and significance. The discussion also compares results to previous studies and addresses reliability and validity. The conclusions summarize what was learned and if research goals were met, while implications and recommendations suggest applications and directions for future work.Data presentation and interpretation I Quantitative Research
Data presentation and interpretation I Quantitative ResearchJimnaira Abanto
╠²
Topics;
DATA PRESENTATION & INTERPRETATION
Preparation in writing your data analysis
Techniques in Data Processing
Presentation and Interpretation of Data
Using statistical Techniques (Sample)The uses of Tables & graphs
The uses of Tables & graphsFranco Jes├║s
╠²
This document discusses how to improve the clarity of tables and graphs in research articles. It provides rules for constructing clear tables, such as splitting large tables and standardizing layout. When presenting tables, common problems to avoid are poorly positioning them on the page and manipulating spacing. Both tables and their contents should be explained in the text. The document also covers best practices for visualizations like pie charts, bar charts, and line graphs, noting tables are best for exact numbers while graphs show trends.8._nadi-2016_introduction_to_data_analysis (1).pptx
8._nadi-2016_introduction_to_data_analysis (1).pptxDurgaSharma21
╠²
This document provides an introduction to data analysis and presentation. It discusses the objective and audience for data presentation and different forms of presentation including tables, charts, and graphs. It covers dimensions and components of tables, as well as layout. It also discusses the purpose, components, characteristics, and types of graphs and charts. The document provides guidance on creating graphs and charts, including organizing data in a table, calculating statistics, and using those to create a visual presentation.Chapter IV -Presentation of Data.pptx
Chapter IV -Presentation of Data.pptxMinardASaladino
╠²
This document discusses principles and methods for presenting quantitative data. It describes how presentation of data through tools like tables, graphs, and diagrams can help organize, summarize, and communicate information in an easy to understand way. Specific types of charts and graphs are described for presenting categorical data like bar charts, pie charts, and pictograms, as well as continuous data through histograms and stem-and-leaf diagrams. The goals of data presentation include facilitating understanding, comparisons, future analysis, and problem solving.More Related Content
What's hot (20)
Data collection and presentation
Data collection and presentationferdaus44
╠²
The document discusses various methods of collecting and presenting data. It describes primary and secondary data collection methods. Primary data is originally collected for a study, while secondary data has already been collected by others. Methods to collect primary data include direct investigation, questionnaires, and schedules. Secondary data can come from published reports. The document also discusses categorical and numerical data types and how to present each type. Categorical data can be presented in summary tables, bar charts, and pie charts. Numerical data presentation methods include frequency distributions, histograms, frequency polygons, and ogives.Thesis writing
Thesis writingCheldy S, Elumba-Pableo
╠²
Guidelines, format and sample on how to write a thesis for beginners. This includes the technical aspect in thesis writingData organization
Data organizationrowell balala
╠²
This document discusses different methods for organizing data in research. It describes data organization as the process of structuring collected factual information in a way that is accepted by the scientific community. Proper data organization is important for research because it allows facts to be represented in context and helps researchers answer questions and hypotheses. The document then explains three common ways to organize data: frequency distribution tables, stem-and-leaf diagrams, and different types of charts including bar charts, pie charts, line charts, and histograms. Guidelines are provided for constructing each of these data organization methods.Characteristics of Research
Characteristics of ResearchMakati Science High School
╠²
This document discusses the characteristics of good research and researchers. It provides 7 key characteristics of research: empirical, logical, cyclical, analytical, critical, methodical, and replicability. It also lists 5 qualities of a good researcher: intellectual curiosity, prudence, healthy criticism, intellectual honesty, and intellectual creativity. The document emphasizes that good research is based on direct experience, uses valid procedures, starts and ends with a problem, uses proven analytical methods, involves careful judgment, follows systematic methods, and can be replicated. Good researchers are curious, careful, open to criticism, honest, and creative in their work.Presentation of data mod 6
Presentation of data mod 6Winona Esel Bernardo
╠²
This document provides an overview of methods for presenting data, including textual, tabular, and graphical methods. It discusses topics such as ungrouped vs. grouped data, frequency distribution tables, stem-and-leaf plots, class boundaries, class midpoints, and class width. The objectives are to describe how to prepare a stem-and-leaf plot, describe data textually, construct a frequency distribution table, create graphs, and interpret graphs and tables. Examples are provided to illustrate these concepts and methods.DIAGRAMMATIC PRESENTATION OF DATA
DIAGRAMMATIC PRESENTATION OF DATAmohini yadav
╠²
This document discusses diagrammatic presentations of data, which use geometric techniques like bar diagrams, pie charts, and cartograms to visually present numerical information. The main advantages of these diagrams are that they are attractive, easy to remember and understand, simplify complex data, and help make comparisons. There are one-dimensional, two-dimensional, and three-dimensional diagrams. Examples provided include line graphs, bar graphs, sub-divided bar graphs, rectangular diagrams, and pie charts. Pie charts in particular can be used to show percentages and proportional relationships between parts of a whole.Review of Related Literature
Review of Related LiteratureJasper Obico
╠²
This document provides an overview of the research process and guidelines for reviewing related literature. It discusses the importance of reviewing related literature to avoid duplicating past studies and provide context for the research problem. The review of related literature should include recent, objective materials that are directly relevant to the study, such as findings, methods, and conclusions from past investigations. When writing the literature review, the researcher should paraphrase sources, cite authors, include only relevant information, and relate sources to the research topic. The review should have a logical flow and avoid lengthy quotes or a list-like format.DATA PROCESSING AND STATISTICAL TREATMENT
DATA PROCESSING AND STATISTICAL TREATMENTAdolf Odani
╠²
This document discusses various statistical concepts and techniques for data processing and analysis. It covers levels of measurement, descriptive statistics like frequency counts and percentages, averages, spreads, and inferential statistics including parametric tests like z-tests, t-tests, F-tests and non-parametric tests like chi-square. Correlation techniques such as Pearson product-moment correlation coefficient and Spearman rank-order correlation coefficient are also summarized. Common statistical tests for comparison including t-tests, F-tests, ANOVA, ANCOVA and chi-square are briefly explained.Presentation of Data
Presentation of DataUmair Anwar
╠²
presentation of data
Tabulated data can be easily understand and interpreted.
Graphical forms makes it possible to easily draw visual impression of data.
It makes comparisons easily.
This kind of method create an imprint on mind for a long period of time.
presentation of data
presentation of dataShafeek S
╠²
This document discusses different types of data and methods for presenting data. It describes qualitative and quantitative data, discrete and continuous data, and primary and secondary data. It also covers nominal and ordinal data. Common methods for presenting data include tabulation and various charts or diagrams. Tabulation involves organizing data into tables, following specific rules. Charts allow visualization of data and include bar charts, histograms, frequency polygons, cumulative frequency diagrams, scatter diagrams, line diagrams, and pie charts. Each chart has specific purposes and guidelines for effective presentation of data.Data presentation/ How to present Research outcome data
Data presentation/ How to present Research outcome dataDr-Jitendra Patel
╠²
In this power point viewer will be able to know about how to present data which is the out comes of any sincere research. The way of presentation is very very important because ultimately it should reach to the particular audience in proper and effective way.
In this PPT viewers will be able to know how to present data obtained as a result of any kind of Research. In report writing the information received need to reach to targeted audience and received data need to reflect in impressive and understandable manner therefore data presentation is very important.
portion covered
1. Data presentation
2. Textual data presentation
3. Tabular data presentation
4. Qualitative Tabular data presentation
5. Quantitative tabular data presentation
6. Temporal tabular data presentation
7. Spatial tabular data presentation
Causal comparative research
Causal comparative researchDua FaTima
╠²
Causal-comparative research attempts to identify cause-and-effect relationships by comparing two or more groups that differ on some independent variable. It is a nonexperimental method used to explore potential causes of existing differences between groups. Researchers select groups that already differ on the independent variable rather than manipulating the variable. Common threats to validity include lack of randomization and inability to control for confounding variables. Analysis typically involves comparing means and using t-tests or ANOVAs to determine if differences between groups are statistically significant.Introduction to statistics and graphical representation
Introduction to statistics and graphical representationAMNA BUTT
╠²
This document provides an introduction to statistics, including definitions and types. It discusses descriptive statistics, which deals with summarizing and describing numerical data through tables, graphs, and measures of center. Inferential statistics makes inferences about populations based on samples. The document also covers graphical representations in statistics, such as bar graphs, line graphs, pie charts, pictograms, and histograms, which visually display statistical data.Topic interpretation of data and its analysis
Topic interpretation of data and its analysisKmTriptiSingh
╠²
This document discusses interpretation and analysis of data in research. It defines interpretation as drawing inferences from collected facts after analysis to find broader meaning. Interpretation considers relationships within data and relates findings to other research. Effective interpretation requires considering all relevant factors and avoiding false generalizations. Data analysis organizes and models data to discover useful information for decision making. It distinguishes between quantitative data analyzed statistically and qualitative data analyzed through interviews, documents, and observation. Both interpretation and analysis are important for extracting meaningful insights from data.presentation of data
presentation of dataBritish Council
╠²
This document discusses various concepts related to data classification and frequency distribution. It defines classification as arranging data into categories based on common characteristics. The four main bases for classification are identified as qualitative, quantitative, geographical, and chronological. Types of classification include one-way, two-way, three-way, and many-way. Key aspects of forming a frequency distribution are discussed such as determining the class intervals, distributing raw data into classes, and calculating cumulative and relative frequencies.Chapter 4
Chapter 4Pauline Velarde
╠²
This chapter discusses the presentation, analysis, and interpretation of data collected for a research study. It provides guidelines for clearly presenting data through tables, figures, and charts. The data should be sufficient, valid, and accurately presented to answer the research questions. Both quantitative and qualitative analysis may be used depending on the type of data. Analysis involves describing patterns in the data and highlighting significant findings without making conclusions. Interpretation explains the implications of the findings and their connection to previous literature. Proper formatting and labeling of tables, graphs, and figures is also covered to effectively communicate the data.Statement of the problem (final)
Statement of the problem (final)Jerome Jardin
╠²
This document provides an outline for developing a research proposal. It includes sections for background information, defining the research problem, formulating objectives, selecting a research topic, and identifying variables and measurements. Sample questions are given to help formulate a clear research problem. The purpose is to guide the researcher in developing the key components of an empirical study, including subjects, test organisms, study location, and phenomenon. Target beneficiaries are identified. References are also included. The overall goal is to design a scientifically sound research proposal or study.Data analysis
Data analysisEko Priyanto
╠²
The document outlines the key components of findings, presentation, and discussion sections of a research study report. It notes that findings should present objective results through descriptive and inferential statistics. These findings are then discussed in a narrative, using tables and figures as needed, to explain their meaning and significance. The discussion also compares results to previous studies and addresses reliability and validity. The conclusions summarize what was learned and if research goals were met, while implications and recommendations suggest applications and directions for future work.Data presentation and interpretation I Quantitative Research
Data presentation and interpretation I Quantitative ResearchJimnaira Abanto
╠²
Topics;
DATA PRESENTATION & INTERPRETATION
Preparation in writing your data analysis
Techniques in Data Processing
Presentation and Interpretation of Data
Using statistical Techniques (Sample)The uses of Tables & graphs
The uses of Tables & graphsFranco Jes├║s
╠²
This document discusses how to improve the clarity of tables and graphs in research articles. It provides rules for constructing clear tables, such as splitting large tables and standardizing layout. When presenting tables, common problems to avoid are poorly positioning them on the page and manipulating spacing. Both tables and their contents should be explained in the text. The document also covers best practices for visualizations like pie charts, bar charts, and line graphs, noting tables are best for exact numbers while graphs show trends.Similar to Presentation of Data (thesis writing) (20)
8._nadi-2016_introduction_to_data_analysis (1).pptx
8._nadi-2016_introduction_to_data_analysis (1).pptxDurgaSharma21
╠²
This document provides an introduction to data analysis and presentation. It discusses the objective and audience for data presentation and different forms of presentation including tables, charts, and graphs. It covers dimensions and components of tables, as well as layout. It also discusses the purpose, components, characteristics, and types of graphs and charts. The document provides guidance on creating graphs and charts, including organizing data in a table, calculating statistics, and using those to create a visual presentation.Chapter IV -Presentation of Data.pptx
Chapter IV -Presentation of Data.pptxMinardASaladino
╠²
This document discusses principles and methods for presenting quantitative data. It describes how presentation of data through tools like tables, graphs, and diagrams can help organize, summarize, and communicate information in an easy to understand way. Specific types of charts and graphs are described for presenting categorical data like bar charts, pie charts, and pictograms, as well as continuous data through histograms and stem-and-leaf diagrams. The goals of data presentation include facilitating understanding, comparisons, future analysis, and problem solving.introduction to statistics
introduction to statisticsBasit00786
╠²
This document provides a summary of different types of graphical representations of data. It begins with an introduction to graphical representation, explaining that graphs make data easier to understand versus words alone. Then, it discusses several specific types of graphs:
- Bar graphs and histograms to represent grouped or ungrouped data
- Line graphs to show changes over time
- Pie charts to compare parts of a whole
It also provides examples of each type of graph and discusses their importance and applications. The document aims to explain the basic principles of graphical representation and how different graph types can be used to visualize various types of statistical data.DATA INTERPRETATION.pdf
DATA INTERPRETATION.pdfDebmalyaGhosh20
╠²
Data interpretation is the process of making sense of processed data presented in various forms like graphs, charts, and tables. These forms include pie charts, bar charts, line charts, and more. The document discusses different types of data interpretation problems like tabulation, missing data problems, and table puzzles. It also provides tips for approaching data interpretation problems like understanding the question, reading charts and tables carefully, and using approximate values when required. Examples of data interpretation questions are included at the end.practical research 1 chapter 4 qualitative research
practical research 1 chapter 4 qualitative researchMaggelAnclote2
╠²
practical research I activity sheets intended for grade 11 students. This Senior High School (SHS) Disaster Readiness and Risk Reduction Quarter 1 ŌĆō Module 1: Basic Concept of Disaster and Disaster Risk for School Year 2021-2022 is intended to help youTables and-figures-business-research
Tables and-figures-business-researchrowenahurley1
╠²
This document discusses various methods for describing data statistically, including tables, figures, and text. It provides examples and guidelines for different types of tables and figures (line graphs, area graphs, bar graphs, pie charts) and discusses when each is most appropriate. The key methods covered are tabular presentations, line graphs to show changes over time, bar graphs for comparisons, and pie charts to show proportions of a whole. It concludes by providing recommendations for choosing between tables, figures, and text based on the type of data being presented and the goals of the analysis.
Numerical & graphical presentation of data
Numerical & graphical presentation of dataSarfraz Ahmad
╠²
The document discusses numerical and graphical presentation of data. It describes including numbers in the main text, using tables, and using graphs. For tables, it provides guidelines on design, such as including a title and source. Tables are best when showing how a category varies at different points. Graphs enable studying relationships and are eye-catching. Common graph types discussed are bar graphs, line graphs, histograms and pie charts. Bar graphs show differences in frequencies using bars of equal width.Results and discussion
Results and discussionDr. Shalini Pandey
╠²
This document discusses the presentation of results and data in research papers. It explains that the results section presents findings from the study in tables, figures and narrative text. The discussion section interprets the results and explains how they help answer the research question. Data should be presented clearly and concisely using tables, figures, graphs or other visuals as appropriate. The purpose is to report the key findings and discuss their implications.

Data Visulalization
Data VisulalizationGirish Khanzode
╠²
This document provides an overview of effective big data visualization. It discusses information visualization and data visualization, including common chart types like histograms, scatter plots, and dashboards. It covers visualization goals, considerations, processes, basics, and guidelines. Examples of good visualization are provided. Tools for creating infographics are listed, as are resources for learning more about data visualization and references. Overall, the document serves as a comprehensive introduction to big data visualization.Presentation of Data using various techniques -reserach.pptx
Presentation of Data using various techniques -reserach.pptxAr.Vrushali Dhamne
╠²
This document discusses various techniques for presenting numerical data, including incorporation into text, tables, and graphs. It describes the principles of effective data presentation, such as arranging data to create interest, presenting information compactly and concisely without losing details, and enabling further statistical analysis. Tables are presented as a common method, with examples of good and poor table design. The document outlines general principles for tables, such as numbering, titling, clear headings, and ordering data numerically or chronologically. It also differentiates between simple tables presenting a single data set and complex tables presenting multiple data sets. Frequency distribution tables are provided as a specific type of table that splits data into class intervals and shows the frequency of values within each interval.Introduction to Data Analysis Using Spread sheet
Introduction to Data Analysis Using Spread sheetbandanadiiMahapatra
╠²
Concepts and theoretical foundations of data analysis Types of data and graphical representation
Types of data and graphical representationReena Titoria
╠²
This document discusses different types of data and ways to represent data graphically and tabularly. It defines qualitative and quantitative data, as well as discrete, continuous, interval and ratio data. Primary and secondary data and nominal and ordinal data are also defined. Common ways to represent data include tables, bar charts, histograms, frequency polygons, cumulative frequency curves, scatter diagrams, line diagrams and pie charts. General principles for effective graphical representation are outlined.Unit III.pptx
Unit III.pptxKennyPratheepKumar
╠²
Unit III covers data visualization. It discusses how data visualization tools are needed to analyze and understand large amounts of data. Effective data visualization presents conclusions, chooses appropriate graph types, and ensures visuals accurately reflect numbers to prevent misinterpretations. History of data visualization is discussed using Napoleon's 1812 march as an example. Advantages of data visualization include easily sharing information and exploring opportunities, while disadvantages can include biased information and losing core messages.
Data Visualization.pptx
Data Visualization.pptxShreenidhi bhat
╠²
1. The document discusses various data visualization techniques including tables, charts like scatter plots, line charts and bar charts, and advanced visualizations like parallel coordinate plots and treemaps.
2. It explains best practices for table and chart design including minimizing non-data ink and aligning text and numbers.
3. Data dashboards are described as visualization tools that automatically update metrics and convey key performance indicators to users through techniques like size, position and color.Data Visualization Power Point Presentations
Data Visualization Power Point Presentationsamnakhantps14039
╠²
iT presenrtation data visualization barchatsPresentation of data ppt
Presentation of data pptRVS Institute of Health Sciences, Sulur, Coimbatore
╠²
The document discusses various methods for presenting data, including tabular, visual, graphical and diagrammatical presentation. It provides guidelines for constructing effective tables, graphs, diagrams and choosing the appropriate method based on the type of data. Tables are useful for presenting exact data while graphs and diagrams make complex data easier to understand visually. The key is to present data in a clear, concise and organized manner that facilitates analysis and understanding.Recently uploaded (20)


Data Privacy presentation for companies.pptx
Data Privacy presentation for companies.pptxharmardir
╠²
**Data Privacy Presentation**
**Introduction**
In the digital age, data privacy has become a crucial topic for individuals and organizations. As technology advances, the amount of personal and sensitive data being collected, stored, and processed continues to grow. Protecting this data from unauthorized access, breaches, and misuse is essential to maintaining trust and compliance with legal requirements.
**What is Data Privacy?**
Data privacy refers to the protection of personal and sensitive information from unauthorized access, use, or disclosure. It involves ensuring that individuals have control over how their data is collected, shared, and used. Data privacy is a fundamental right and plays a critical role in cybersecurity.
**Why is Data Privacy Important?**
1. **Protecting Personal Information:** Safeguarding data such as financial records, health information, and personal identifiers prevents identity theft and fraud.
2. **Regulatory Compliance:** Governments and international bodies have implemented strict data protection laws, such as the General Data Protection Regulation (GDPR) and the California Consumer Privacy Act (CCPA), to ensure companies handle data responsibly.
3. **Maintaining Trust:** Organizations that prioritize data privacy build trust with their customers and stakeholders, enhancing their reputation and credibility.
4. **Preventing Cyber Threats:** Cybercriminals often target personal and corporate data for financial gain. Strong data privacy measures reduce the risk of data breaches and cyberattacks.
**Key Data Privacy Regulations**
- **General Data Protection Regulation (GDPR):** Enforced in the European Union, GDPR sets strict guidelines on data collection, processing, and storage. It grants individuals rights over their personal data and imposes hefty fines for non-compliance.
- **California Consumer Privacy Act (CCPA):** A U.S.-based regulation that provides California residents with rights to know, delete, and opt out of the sale of their personal data.
- **Health Insurance Portability and Accountability Act (HIPAA):** Protects sensitive health information in the U.S.
- **Personal Data Protection Act (PDPA):** Enforces data protection measures in countries like Singapore.
**Challenges in Data Privacy**
1. **Growing Volume of Data:** With the rise of big data and cloud storage, managing and securing vast amounts of information is challenging.
2. **Evolving Cyber Threats:** Hackers continuously develop new methods to exploit vulnerabilities, making data security a constant battle.
3. **Lack of Awareness:** Many users and employees are unaware of best practices for protecting their data, leading to unintentional breaches.
4. **Compliance Complexity:** Different regulations across regions create difficulties for multinational organizations in ensuring full compliance.
**Best Practices for Data Privacy**
- **Data Encryption:** Encrypt sensitive information to protect it from unauthorized access.
- **Strong AuthentiBEST MACHINE LEARNING INSTITUTE IS DICSITCOURSES
BEST MACHINE LEARNING INSTITUTE IS DICSITCOURSESgs5545791
╠²
Machine learning is revolutionizing the way technology interacts with data, enabling systems to learn, adapt, and make intelligent decisions without human intervention. It plays a crucial role in various industries, from healthcare and finance to automation and artificial intelligence. If you want to build a successful career in this field, joining the Best Machine Learning Institute In Rohini is the perfect step. With expert-led training, hands-on projects, and industry-recognized certifications, youŌĆÖll gain the skills needed to thrive in the AI-driven world. If you are interested, then Enroll Fast ŌĆō limited seats are available!
9th Edition of International Research Awards
9th Edition of International Research Awardssciencereviewerview
╠²
9th Edition of International Research Awards |28-29 March 2025 | San Francisco, United States
The International Research Awards recognize exceptional research contributions, innovation, and excellence across various fields. This prestigious award honors outstanding researchers, scientists, and scholars who have made significant impacts in their respective disciplines, fostering a culture of innovation and discovery.
Industry_Use_Cases.ppt Industry_Use_Cases.ppt
Industry_Use_Cases.ppt Industry_Use_Cases.pptssuser3e8ddb
╠²
Industry_Use_Cases.pptIndustry_Use_Cases.pptOptimizing Common Table Expressions in Apache Hive with Calcite
Optimizing Common Table Expressions in Apache Hive with CalciteStamatis Zampetakis
╠²
In many real-world queries, certain expressions may appear multiple times, requiring repeated computations to construct the final result. These recurring computations, known as common table expressions (CTEs), can be explicitly defined in SQL queries using the WITH clause or implicitly derived through transformation rules. Identifying and leveraging CTEs is essential for reducing the cost of executing complex queries and is a critical component of modern data management systems.
Apache Hive, a SQL-based data management system, provides powerful mechanisms to detect and exploit CTEs through heuristic and cost-based optimization techniques.
This talk delves into the internals of Hive's planner, focusing on its integration with Apache Calcite for CTE optimization. We will begin with a high-level overview of Hive's planner architecture and its reliance on Calcite in various planning phases. The discussion will then shift to the CTE rewriting phase, highlighting key Calcite concepts and demonstrating how they are employed to optimize CTEs effectively.Kaggle & Datathons: A Practical Guide to AI Competitions
Kaggle & Datathons: A Practical Guide to AI Competitionsrasheedsrq
╠²
Kaggle & Datathons: A Practical Guide to AI Competitions
Pink Yellow Purple Lifestyle Vision Board Scribbles Doodles Whiteboard Pres_2...
Pink Yellow Purple Lifestyle Vision Board Scribbles Doodles Whiteboard Pres_2...jarreldelacruz31
╠²
Intuitive thinking Leveraging-Virtual-Reality-(VR)-and-Augmented-Reality-(AR)-for-Enhanced-Touri...
Leveraging-Virtual-Reality-(VR)-and-Augmented-Reality-(AR)-for-Enhanced-Touri...Krishna Khanal
╠²
This chapter proposes to explore the intersection of virtual reality (VR), augmented reality (AR), data analytics, and marketing in the context of the tourism and events industry. As technology continues to advance, organizations within this sector are seeking innovative and transformative ways to engage and attract tourists and event attendees. VR and AR have emerged as powerful tools for creating immersive experiences, while data analytics provides insights into consumer behavior and preferences. This chapter will examine how these technologies can be integrated into marketing strategies to enhance engagement, visitor experiences, and decision- making processes. By discussing real-world case studies, ethical considerations, and future trends, this chapter aims to provide a comprehensive overview of the subject and offer practical insights for professionals and researchers in the field.International Journal on Cloud Computing: Services and Architecture (IJCCSA)
International Journal on Cloud Computing: Services and Architecture (IJCCSA)ijccsa
╠²
Cloud computing helps enterprises transform business and technology. Companies have begun to
look for solutions that would help reduce their infrastructure costs and improve profitability. Cloud
computing is becoming a foundation for benefits well beyond IT cost savings. Yet, many business
leaders are concerned about cloud security, privacy, availability, and data protection. To discuss
and address these issues, we invite researches who focus on cloud computing to shed more light
on this emerging field. This peer-reviewed open access Journal aims to bring together researchers
and practitioners in all security aspects of cloud-centric and outsourced computing, including (but
not limited to):50-Database Efficiency 101 Understanding and Implementing PostgreSQL Indexes....
50-Database Efficiency 101 Understanding and Implementing PostgreSQL Indexes....Doug Ortiz
╠²
Understanding and Implementing PostgreSQL Indexes
Design Data Model Objects for Analytics, Activation, and AI
Design Data Model Objects for Analytics, Activation, and AIaaronmwinters
╠²
Explore using industry-specific data standards to design data model objects in Data Cloud that can consolidate fragmented and multi-format data sources into a single view of the customer.
Design of the data model objects is a critical first step in setting up Data Cloud and will impact aspects of the implementation, including the data harmonization and mappings, as well as downstream automations and AI processing. This session will provide concrete examples of data standards in the education space and how to design a Data Cloud data model that will hold up over the long-term as new source systems and activation targets are added to the landscape. This will help architects and business analysts accelerate adoption of Data Cloud.
Herding behavior Experimental Studies --AlisonLo
Herding behavior Experimental Studies --AlisonLoAlisonKL
╠²
My experimental studies on information cascades and herding behavior, comparing Bayesian belief updating with other behavioral heuristics that account for the observed behaviors
Presentation of Data (thesis writing)
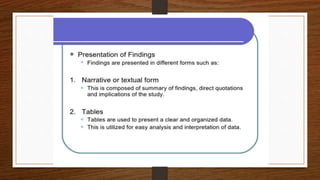
- 1. PRESENTATION OF DATA BY: Charlene Eve L. Saligumba
- 2. What is presentation? ŌĆó It is the process of organizing data into logical and meaningful categories and classification to make them amenable to study.
- 3. What is data? ŌĆó A collection of facts and figures that needs to be justified.
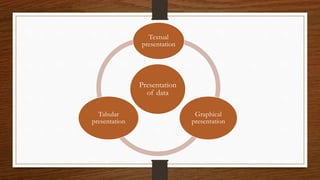
- 4. PRESENTATION OF DATA ŌĆó The presentation of data means exhibition of the data in such a clear and attractive manner that these are easily understood and analyzed. There are many forms of presentation of data.
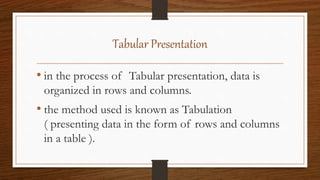
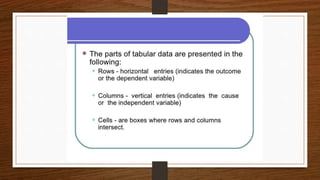
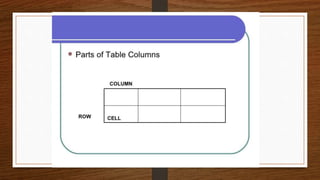
- 6. Tabular Presentation ŌĆó in the process of Tabular presentation, data is organized in rows and columns. ŌĆó the method used is known as Tabulation ( presenting data in the form of rows and columns in a table ).
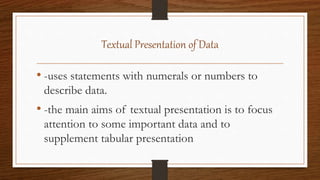
- 7. Textual Presentation of Data ŌĆó -uses statements with numerals or numbers to describe data. ŌĆó -the main aims of textual presentation is to focus attention to some important data and to supplement tabular presentation
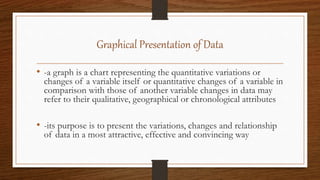
- 8. Graphical Presentation of Data ŌĆó -a graph is a chart representing the quantitative variations or changes of a variable itself or quantitative changes of a variable in comparison with those of another variable changes in data may refer to their qualitative, geographical or chronological attributes ŌĆó -its purpose is to present the variations, changes and relationship of data in a most attractive, effective and convincing way
- 9. Advantages of Tabular over Textual ŌĆó Statistical tables are concise ŌĆó Data are more easy to read: and ŌĆó Tables give the whole information even without combining numerals with textual matter
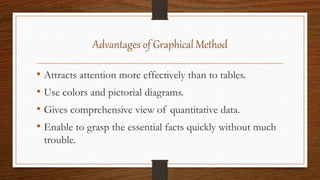
- 10. Advantages of Graphical Method ŌĆó Attracts attention more effectively than to tables. ŌĆó Use colors and pictorial diagrams. ŌĆó Gives comprehensive view of quantitative data. ŌĆó Enable to grasp the essential facts quickly without much trouble.
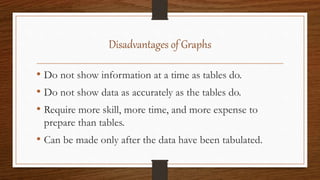
- 11. Disadvantages of Graphs ŌĆó Do not show information at a time as tables do. ŌĆó Do not show data as accurately as the tables do. ŌĆó Require more skill, more time, and more expense to prepare than tables. ŌĆó Can be made only after the data have been tabulated.
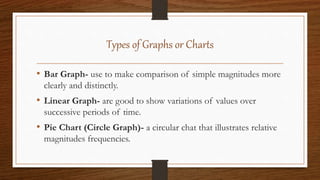
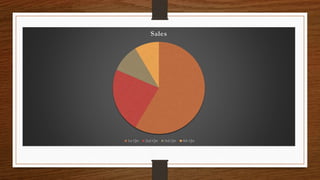
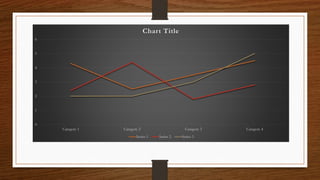
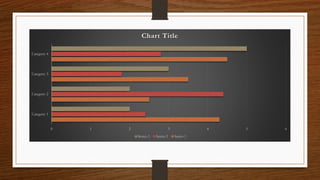
- 12. Types of Graphs or Charts ŌĆó Bar Graph- use to make comparison of simple magnitudes more clearly and distinctly. ŌĆó Linear Graph- are good to show variations of values over successive periods of time. ŌĆó Pie Chart (Circle Graph)- a circular chat that illustrates relative magnitudes frequencies.
- 16. Sales 1st Qtr 2nd Qtr 3rd Qtr 4th Qtr
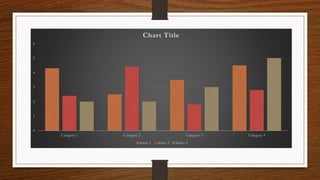
- 17. 0 1 2 3 4 5 6 Category 1 Category 2 Category 3 Category 4 Chart Title Series 1 Series 2 Series 3
- 18. 0 1 2 3 4 5 6 Category 1 Category 2 Category 3 Category 4 Chart Title Series 3 Series 2 Series 1
- 19. 0 1 2 3 4 5 6 Category 1 Category 2 Category 3 Category 4 Chart Title Series 1 Series 2 Series 3
- 20. Answers: ŌĆó Pie Chart ŌĆó Linear or Line Graph ŌĆó Bar Graph ŌĆó Column Chart
- 21. The EndŌĆ”ŌĆ” Thank you for listening! ’üŖ ’üŖ ’üŖ