Presentation1
Download as pptx, pdf0 likes46 views
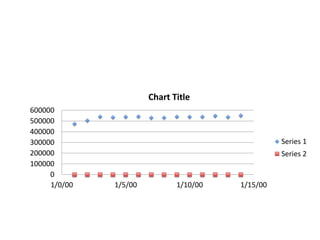
This chart shows two data series over time from January 1st to January 15th. Series 1 starts at 0 and increases steadily to around 600,000 by January 15th. Series 2 starts at 100,000 and also increases steadily but at a lower rate than Series 1, reaching around 400,000 by January 15th.
1 of 1
Download to read offline
Ad
Recommended
PDF
Growth responses of hybrid corn applied with black soldier fly frass (BSFF)Open Access Research Paper?
PDF
Green Talks LIVE | Adapting to a drier world in a changing climate: Launch of...OECD Environment?
PPTX
0945 Zoe Le Grand Project Management in a Volatile world.pptxAssociation for Project Management ?
PPTX
1155 APM Conference 2025 - How to Embed Sustainability into the Entire Projec...Association for Project Management ?
More Related Content
Recently uploaded (20)
PDF
Growth responses of hybrid corn applied with black soldier fly frass (BSFF)Open Access Research Paper?
PDF
Green Talks LIVE | Adapting to a drier world in a changing climate: Launch of...OECD Environment?
PPTX
0945 Zoe Le Grand Project Management in a Volatile world.pptxAssociation for Project Management ?
PPTX
1155 APM Conference 2025 - How to Embed Sustainability into the Entire Projec...Association for Project Management ?
Growth responses of hybrid corn applied with black soldier fly frass (BSFF)Open Access Research Paper
?
1155 APM Conference 2025 - How to Embed Sustainability into the Entire Projec...Association for Project Management
?
Featured (20)
PDF
Artificial Intelligence, Data and Competition ¨C SCHREPEL ¨C June 2024 OECD dis...OECD Directorate for Financial and Enterprise Affairs?
PDF
Social Media Marketing Trends 2024 // The Global Indie InsightsKurio // The Social Media Age(ncy)?
Artificial Intelligence, Data and Competition ¨C SCHREPEL ¨C June 2024 OECD dis...OECD Directorate for Financial and Enterprise Affairs
?
Ad
Presentation1
- 1. 0 100000 200000 300000 400000 500000 600000 1/0/00 1/5/00 1/10/00 1/15/00 Chart Title Series 1 Series 2