Presentation1 -
- 1. Free Vibration Of Plate Under Free-Free Condition By Dipak Prasad (Exam roll: 111204020) Under the guidance of Prof. Chaitali Ray INDIAN INSTITUTE OF ENGINEERING SCIENCE AND TECHNOLOGY SHIbpUR, HOwRAH- 711103 MAY 2016
- 2. INTRODUCTION ’üČ Vibration is the major unacceptable property associated with any solid material by virtue of its stiffness. ’üČ Vibration is capable of destroying any structure within its design life due to its feature of high amplitude in resonance stage. ’üČ Here only free vibration of plate is concerned under free- free condition. ’üČ As the title suggests no external exciting force is acting on plate.
- 3. OBJECTIVE ’āśAnother notable feature of project is free-free condition i.e. each element is free to displaced in all 6 directions(3 translational and 3 rotational). ’āśFree-freevibrational analysisisused for determination of behavior of airplanesand ships. ’āśAnalysishelpsin determination of frequency of different modesof vibration which would help in designing structuressafefrom view of resonance.
- 4. AUTHENTICITY OF RESULT ’üČ Free-free vibration analysis is the simplest technique for checking authenticity of different softwareŌĆÖs results regarding any plate vibration. Correlation between experimental & theoretical modal shapes can be done by calculation of MAC. If MAC value lies between 0.9 to 1, both resultsaresaid to in good correlation. ’üČ Thus it helps in updation of simple FE assumptions regarding structural geometry, boundary conditions, material propertiesetc.
- 5. NUMERICAL ANALYSIS ’ā╝Numerical analysis is done with help of ANSYS Mechanical APDL ’ā╝Dimension of sample plate is 270mm├Ś270mm. ’ā╝Thickness of plate is 5 mm. ’ā╝Modulus of elasticity of plate is 2x10¹¹ N/m2 and PoissonŌĆÖs ratio is 0.3. ’ā╝For free-free condition degree of freedom assumed per node is 6. ’ā╝Thus element is selected properly which could satisfy the criteria stated above.
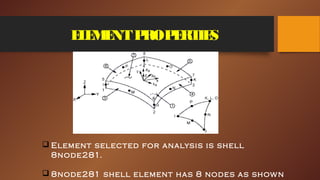
- 6. ELEMENTPROPERTIES ’ü▒ Element selected for analysis is shell 8node281. ’ü▒ 8node281 shell element has 8 nodes as shown
- 7. ELEMENTPROPERTIES ’üČShell elements are typically planarelements. ’üČThey are used to model thin structures which will experience bending. ’üČElement features: - ’āś6 DOFpernode (3 translations and 3 rotations) for3-Delements. ’āśBending modes are included. ’āśMore than 1 stress at each point on the element.
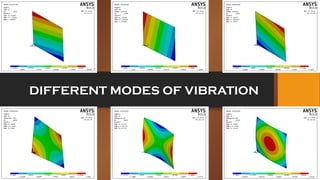
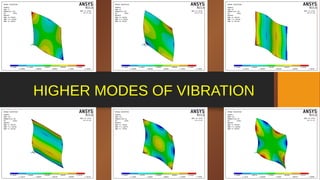
- 8. MESHING AND SOLVER ’ü▒ Plate is divided into 10X10 meshes. ’ü▒ Mode is extracted by Block Lanczos method. ’ü▒ No of modes extracted is 12. ’ü▒ Now solution is done with help of solver. ’ü▒ Results are obtained by plotting different modes of vibration pattern in general prospect. ’ü▒ Here first three modes of vibration shows zero frequency and after that consecutive three modes are showing frequency of 222.79,326.35,404.07 respectively.
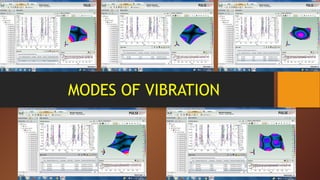
- 9. DIFFERENT MODES OF VIBRATION
- 10. HIGHER MODES OF VIBRATION
- 11. RAYLEIGH DAMPING ’üČ [M][+[C][+[K][x]=[0] ’üČ [+2 []+ 2[x]=[0]╬ŠŽē Žē ’üČ [C]= [M]+ [K]╬▒ ╬▓ ’üČ 2 = + 2╬ŠŽē ╬▒ Žē ╬▓ ’üČ = 0.5[1/ ]╬Š Žē Žē ’üČ [ = 0.5[ ’üČ METHOD OF MODE ExTRACTION’āĀ QR-DAMPED ╠²
- 12. EXPERIMENTAL SET-UP An Impact hammer (B&K type ŌĆō 8206) Unidirectional piezoelectric CCLD accelerometer (B&K type ŌĆō 4507) B & K modal analysis set up
- 13. EXPERIMENTAL SET-UP B & K Data acquisition system (Photon plus) Freely hanging plate with copper wire Modal analysis software RT pro
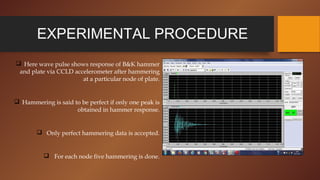
- 14. EXPERIMENTAL PROCEDURE ’ü▒ Here wave pulse shows response of B&K hammer and plate via CCLD accelerometer after hammering at a particular node of plate. ’ü▒ Hammering is said to be perfect if only one peak is obtained in hammer response. ’ü▒ Only perfect hammering data is accepted. ’ü▒ For each node five hammering is done.
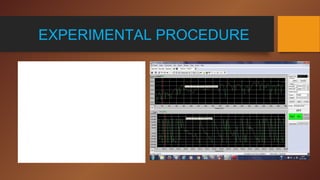
- 15. EXPERIMENTAL PROCEDURE ’üČ Here wave pulse shows the actual plate vibration pattern. ’üČ Peak is studied near to frequency obtained in numerical analysis. ’üČ Only those peaks are valid where phase angle is 90 or -90 ’üČ Data is taken by hammering at various nodes. ╠²
- 16. DATA ACQUISITION ’ü▒Proper dataafter hammering for each nodeisstored in form of .UNV file. ’ü▒Experiment on 5 mm thick plateisdoneby dividing it into 5X5 meshesi.e. it consistsof 36 nodes. Henceafter wholeexperiment 36 unv filesarecreated. ’ü▒All thesedatafilesaregiven asinput in pulse-reflex which in turn providesnatural frequencies, damping, +z displacement of each nodefor different modes.
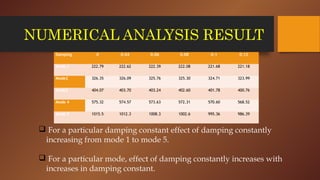
- 17. NUMERICAL ANALYSIS RESULT Damping 0 0.04 0.06 0.08 0.1 0.12 Mode 1 222.79 222.62 222.39 222.08 221.68 221.18 Mode2 326.35 326.09 325.76 325.30 324.71 323.99 Mode3 404.07 403.70 403.24 402.60 401.78 400.76 Mode 4 575.32 574.57 573.63 572.31 570.60 568.52 Mode 5 1015.5 1012.3 1008.3 1002.6 995.36 986.39 ’ü▒ For a particular damping constant effect of damping constantly increasing from mode 1 to mode 5. ’ü▒ For a particular mode, effect of damping constantly increases with increases in damping constant.
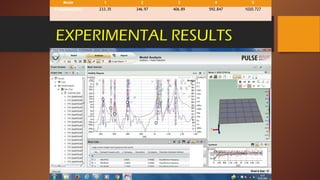
- 18. EXPERIMENTAL RESULTS Mode 1 2 3 4 5 Frequency(Hz) 233.35 346.97 406.89 592.847 1020.727
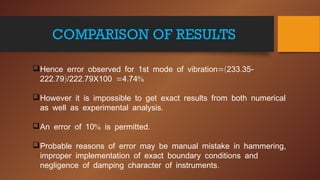
- 20. COMPARISON OF RESULTS ’ü▒ =( . -Hence error observed for 1st mode of vibration 233 35 . )/ . = . %222 79 222 79X100 4 74 ’ü▒However it is impossible to get exact results from both numerical .as well as experimental analysis ’ü▒ % .An error of 10 is permitted ’ü▒ ,Probable reasons of error may be manual mistake in hammering improper implementation of exact boundary conditions and .negligence of damping character of instruments
- 21. MODAL ASSURANCE CRITERION ’üČThe criteria to be fulfilled by experimental modal vectors are MAC. ’üČThe experimental mode shape should be compatible with the numerical mode shapes so that they are consistent in nature. ’üČMAC values provides a quantitative confidence factor whether the mode shapes obtained experimentally are in good correlation with those obtained numerically
- 22. MAC CALCULATION MACij = {╬”i} ’āĀ experimental mode shape vectors {╬©j} ’āĀ numerical analysis mode shape vectors ╠² ’āśvalue of MAC varies from 0 to 1. ’āśFor good correlation it should lie between 0.9 to 1.
- 23. MAC RESULT MAC MATRIX FOR COMPARISON OF MODE SHAPE FREQUENCY 222.795 326.35 404.068 575.321 1015.46 233.35 0.862816262 0.29507114 0.703367466 0.639903025 0.716872596 346.97 0.624354444 0.570119359 0.704684214 0.703426357 0.8375122 406.89 0.683773066 0.236488145 0.854968845 0.61523191 0.757796782 592.847 0.677345773 0.383981721 0.630719163 0.68663316 0.743716236 1020.727 0.615133544 0.448832855 0.661778809 0.69898193 0.743109009
- 24. OBSERVATIONS ’ü▒One of the major observation which can be drawn is that first three modes of vibration shows zero frequency in numerical analysis. ’ü▒The probable reason behind such phenomena is representing the rigid body motion of plate where no vibration occurred. ’ü▒Based on available data error observed is 4.74%.
- 25. OBSERVATIONS ’ü▒Best MAC values had been observed for 1st and 3rd mode of vibration with 0.863 and 0.855 respectively. ’ü▒Worst MAC value had been observed for 2nd mode of vibration with 0.57. ’ü▒Here it should be noticed that inspite of very less error in frequency values of all five modes, experimental and FE model canŌĆÖt be said to be in good correlation from mode shape point of view.
- 26. FUTURE ASPECTS ’ü▒ Further verification of results is necessary. Experiment should be revised again and compared with numerical results. ’ü▒If MAC values are not proper than assumptions regarding structural geometry, boundary conditions made for numerical analysis should be revised. ’ü▒ It is very much necessary that analytical results would be a true representation of actual behavior of structure not only in view of frequency but also deflections, bending moment, shear force.
- 27. REFERENCES ’āś https://en.wikipedia.org/wiki/Br%C3%BCel_%26_Kj%C3%A6r ’āś https://www.researchgate.net/post/which_is_the_best_element_ choice_for_multilayered_FRP_material_in_ANSYS ’āś https:// www.researchgate.net/post/what_is_the_application_of_freefree_modal_analysis_and_constrained_modal_analysis ’āś The Modal Assurance Criterion ŌĆō twenty years of use and abuse, Randall J Allemang, university of Ohio ’āś Application of MAC in frequency domain, D. Fotsch and D.J. Ewins, dynamic section, Mechanical engineering department, Imperial college of Science, Medicine and Technology, United Kingdom ’āś Modal Assurance Criterion, Miroslav Pastor, Michal Binda, Tomas Harcarik, Technical University of Kosice, Faculty of Mechanical Engineering






![RAYLEIGH DAMPING
’üČ [M][+[C][+[K][x]=[0]
’üČ [+2 []+ 2[x]=[0]╬ŠŽē Žē
’üČ [C]= [M]+ [K]╬▒ ╬▓
’üČ 2 = + 2╬ŠŽē ╬▒ Žē ╬▓
’üČ = 0.5[1/ ]╬Š Žē Žē
’üČ [ = 0.5[
’üČ METHOD OF MODE ExTRACTION’āĀ QR-DAMPED
╠²](https://image.slidesharecdn.com/9f0f7239-82f2-4c82-bc43-def2a5cbdfa7-160803112122/85/Presentation1-11-320.jpg)
