Principles of Infographic Design
?Download as PPTX, PDF?
3 likes?740 views

This document provides tips and principles for designing effective infographics. It discusses popular infographic design tools and templates. It also summarizes the guidelines of statistician Edward Tufte, who advocated showing data clearly without distorting or disguising it. Examples are given of good infographic design that follows Tufte's principles as well as "chart junk" examples that do not effectively display data. The document concludes with discussing principles of professional business charts and effective use of color, text, and visual elements in infographic design.

![InfoActive: Interactive, Live And Mobile-Friendly
Ī░ Č╠įuŻ║ĄĮ¼Fį┌▀Ćø]═©▀^į]āį =┐┌= Ī▒](https://image.slidesharecdn.com/infographicnew-160112125844/85/Principles-of-Infographic-Design-3-320.jpg)


![Infographic į¬╦ž
╬─ūų Ņü╔½
¤o▓╩╔½║├ė├ę²ī¦ķåūx
╦ž▓─ łD▒Ē
├└ė^ĪółD╩ŠĪóį]ĮŌ ūŅ┤¾┘YėŹ─½╦«▒╚](https://image.slidesharecdn.com/infographicnew-160112125844/85/Principles-of-Infographic-Design-46-320.jpg)


Principles of Infographic Design
- 1. Principles of Infographic Design Tips on how we graphic like a designer Leo
- 2. Infogr.am: All The Bells And Whistles Ī░ Č╠įuŻ║╣Ā▒Š╔┘Ż¼«ŗ╠ž╩ŌłD║├ė├ Ī▒
- 3. InfoActive: Interactive, Live And Mobile-Friendly Ī░ Č╠įuŻ║ĄĮ¼Fį┌▀Ćø]═©▀^į]āį =┐┌= Ī▒
- 4. Piktochart: Drag-And-Drop Templates Galore Ī░ Č╠įuŻ║IconČÓŻ¼┐╔┤µłD Ī▒
- 10. Distribution
- 12. Time Series
- 13. Edward Tufte Born 1942 Statistician Graphic Designer Author
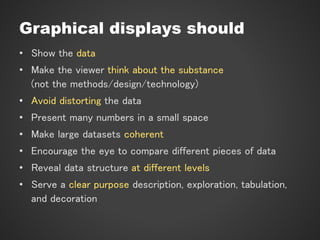
- 14. Graphical displays should ? Show the data ? Make the viewer think about the substance (not the methods/design/technology) ? Avoid distorting the data ? Present many numbers in a small space ? Make large datasets coherent ? Encourage the eye to compare different pieces of data ? Reveal data structure at different levels ? Serve a clear purpose description, exploration, tabulation, and decoration
- 15. Traffic deaths
- 16. Traffic deaths
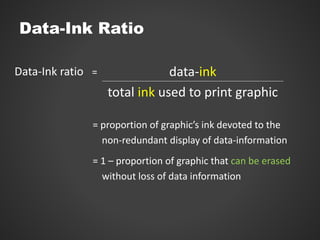
- 18. Data-Ink Ratio Data-Ink ratio = data-ink total ink used to print graphic = proportion of graphicĪ»s ink devoted to the non-redundant display of data-information = 1 ©C proportion of graphic that can be erased without loss of data information
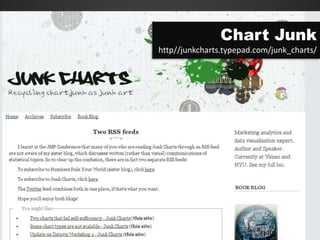
- 19. Chart Junk 3D = no extra information Latest results from only 6 months
- 21. Chart Junk
- 23. Substance?......... NO! ONLY 5 NUMBERS!! ColoursĪŁĪŁĪŁĪŁĪŁ YES 3D effectsĪŁĪŁĪŁ.. YES Disguised redundancy...YES Mirror imaging Curved lines Tufte (1983, p.118) says, "This may well be the worst graphic ever to find its way into print."
- 30. ČÓ▒õŽŅĮ╗▓µ
- 31. ČÓ▒õŽŅĮ╗▓µ
- 40. Principles ? Apprehension ? Clarity ? Consistency ? Efficiency ? Necessity ? Truthfulness
- 45. Excel Demo
- 46. Infographic į¬╦ž ╬─ūų Ņü╔½ ¤o▓╩╔½║├ė├ę²ī¦ķåūx ╦ž▓─ łD▒Ē ├└ė^ĪółD╩ŠĪóį]ĮŌ ūŅ┤¾┘YėŹ─½╦«▒╚
- 54. Colors make differences ExcelŅAįO╔½▓╩ ? ═¼ę╗Ę▌łD▒Ēā╚ę╗ų┬’LĖ± ║åå╬Ż║╔½ŽĄąĪņČ3ĘN (¤o▓╩╔½▓╗ī┘ņČ╚╬║╬╔½ŽĄ) ╔Ņ£\Īó’¢║═Č╚▓Ņ«É 0 1 2 3 4 5 6 ŅÉäe 1 ŅÉäe 2 ŅÉäe 3 ŅÉäe 4 ╠O╣¹ ķ┘ūė ŽŃĮČ ╠½Ļ¢╗© 0 1 2 3 4 5 6 ŅÉäe 1 ŅÉäe 2 ŅÉäe 3 ŅÉäe 4 ╠O╣¹ ķ┘ūė ŽŃĮČ ╠½Ļ¢╗©
- 55. ╦ž▓─
- 56. ╦ž▓─
- 57. Excel Demo