Pro active management of visual appearance of products
- 1. Pro-active Management of Visual Appearance of Products: from the Automotive Sector to other Industries Fco M. Mart├Łnez-Verd├║ Color & Vision Group: http://web.ua.es/en/gvc University of Alicante (Spain) verdu@ua.es
- 2. ’é¦ Visual appearance of products ’é¦ Color & Texture managed currently in the automotive sector ’é¦ Challenges for its optimal and efficient management ’é¦ Multi-scale approach (bottom-up vs. top-down) ’é¦ Foundations for pro ŌĆō active Quality Management: ’é¦ Visual and instrumental correlation ’é¦ Multivariate statistics: visual psychophysics, DoE, etc. ’é¦ Conclusions OUTLINE
- 3. ’é¦ Great variety of visual attributes in daily products VISUAL APPEARANCE OF PRODUCTS
- 4. VISUAL APPEARANCE OF PRODUCTS Dyes & Pigments New visual appearance attributes Multi-functional properties Coloration processes Market forces: performance ŌĆō cost balance, customer preferences, etc. Continuous loop
- 5. ’é¦ Color & Texture ’é¦ Reflection & Transmission ’é¦ Goniochromatism: BRDF ’é¦ Sparkle & Graininess VISUAL APPEARANCE IN AUTOMOTIVE ┬« Wikipedia
- 6. ’é¦ MSc degree in Color Technology for the Automotive Sector VISUAL APPEARANCE IN AUTOMOTIVE
- 7. ŌĆó Bottom ŌĆō up: ŌĆó Many variables ŌĆó Impracticable ŌĆó Top ŌĆō down: ŌĆó Feasible ŌĆó How? CHALLENGES: MULTI ŌĆō SCALE APPROACH Color, Texture Radiative transfer theory Particles interaction Light ŌĆō Matter interaction particle models Light sources tech., Pigments, dyes Gloss, sparkle, etc. Color differences Visual appearance Emission SPD(l) Reflection r(l) Transmission t(l) Coefficients: Absorption K Scattering S Substrate Coloration application processes: no. layers, etc. Phys. + Chem. Particles & Substrate: Size, Shape, Thickness Refraction index, Extinction index, Roughness, etc. THEORETICALAPPROACH EXPERIMENTALAPPROACH
- 8. ŌĆó But, in this case (empirical approach = top ŌĆō down), the typical challenge is how we can understand and manage by a pro-active way the relevance and interplay of nano/micro (structural) parameters, and other ones (coloration application processes, optical, etc.), on final visual appearance attributes (color, texture, etc.). ŌĆó HOW? ŌĆó Metrology, Visual Psychophysics, and Statistics ŌĆó inter and multi-disciplinary (hybrid) approach CHALLENGES: MULTI ŌĆō SCALE APPROACH
- 9. ŌĆó IDEAL CONTEXT: ŌĆó BiRD motto: ŌĆó What You See Is What You Measure Rightly = WYSIWYMR ŌĆó ICC profile format (Graphics Arts) ŌĆó Objective: WYSIWYG VISUAL & INSTRUMENTAL CORRELATION Instrumental scaling Visualassessment ?
- 10. VISUAL & INSTRUMENTAL CORRELATION Visual appearance of materials DT = f(DE, DG, DS, ...) is the ŌĆ£GOALŌĆØ
- 11. ŌĆó Human visual perception tasks: ŌĆó Detection ŌĆó Influence of viewing distance and geometry ŌĆó Spatio-chromatic dithering ŌĆó Scaling (ordering: from less to more) ŌĆó Color (from spectral data to 3 dim.), ŌĆó Sparkle (2 dim.), Graininess (1 dim.), etc. ŌĆó Color & Texture palettes ŌĆó Discrimination (differences): ŌĆó Perceptibility vs. Acceptability ŌĆó FAIL vs. PASS controls by tolerance ellipses VISUAL & INSTRUMENTAL CORRELATION
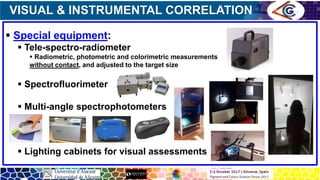
- 12. ’é¦ Special equipment: ’é¦ Tele-spectro-radiometer ’é¦ Radiometric, photometric and colorimetric measurements without contact, and adjusted to the target size ’é¦ Spectrofluorimeter ’é¦ Multi-angle spectrophotometers ’é¦ Lighting cabinets for visual assessments VISUAL & INSTRUMENTAL CORRELATION
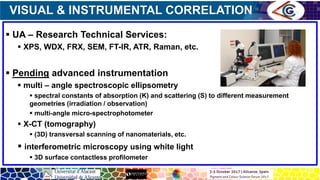
- 13. ’é¦ UA ŌĆō Research Technical Services: ’é¦ XPS, WDX, FRX, SEM, FT-IR, ATR, Raman, etc. ’é¦ Pending advanced instrumentation ’é¦ multi ŌĆō angle spectroscopic ellipsometry ’é¦ spectral constants of absorption (K) and scattering (S) to different measurement geometries (irradiation / observation) ’é¦ multi-angle micro-spectrophotometer ’é¦ X-CT (tomography) ’é¦ (3D) transversal scanning of nanomaterials, etc. ’é¦ interferometric microscopy using white light ’é¦ 3D surface contactless profilometer VISUAL & INSTRUMENTAL CORRELATION
- 14. ŌĆó Current challenges in color industries: ŌĆó Gonio ŌĆō appearance: color & texture ŌĆó Spectral BRDF ’ā× own color palette ŌĆó Formulation of new colors outside R├Čsch ŌĆō McAdam solid ŌĆó Tolerances ’ā× Total Visual Appearance (color, gloss, sparkle, etc.) ŌĆó Measurement without contact (by tele ŌĆō spectroradiometer, etc.) ŌĆó Reversible or irreversible electro / thermo- chromism, etc. ŌĆó Real colored products vs. its efficient digital simulation ŌĆó Color gamut of displays technologies ŌĆó Pro ŌĆō active prediction models for visual quality of products VISUAL & INSTRUMENTAL CORRELATION
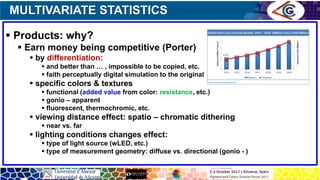
- 15. ’é¦ Products: why? ’é¦ Earn money being competitive (Porter) ’é¦ by differentiation: ’é¦ and better than ŌĆ” , impossible to be copied, etc. ’é¦ faith perceptually digital simulation to the original ’é¦ specific colors & textures ’é¦ functional (added value from color: resistance, etc.) ’é¦ gonio ŌĆō apparent ’é¦ fluorescent, thermochromic, etc. ’é¦ viewing distance effect: spatio ŌĆō chromatic dithering ’é¦ near vs. far ’é¦ lighting conditions changes effect: ’é¦ type of light source (wLED, etc.) ’é¦ type of measurement geometry: diffuse vs. directional (gonio - ) MULTIVARIATE STATISTICS
- 16. ’é¦ Processes: why? how? when? ’é¦ Design and production easy to be managed ’é¦ Feasibility & stability of original product model (std. or master) ’é¦ Ease for creativity & innovation ’é¦ Repeatability & accuracy of batches ’é¦ Measure to save time & money: ’é¦ Comparison with error range ’ā× TOLERANCE ’é¦ Multi ŌĆō scale process: nano/micro ’é½ visual ’é¦ From bottom ŌĆō up approach ’ā× top ŌĆō down ’é¦ Predictive model of pro ŌĆō active management by: ’é¦ Statistical design of experiments (DoE) ’é¦ Regression models MULTIVARIATE STATISTICS DEAUDI2000 < ’ā¢ 2 = 1.41 OK DEAUDI2000 ’āÄ [’ā¢ 2 , ’ā¢ 3 = 1.73] cOK DEAUDI2000 > 1.73 FAIL
- 17. ŌĆó Statistical Design of Experiments (DoE) ŌĆó Statistical technique used in quality control for planning, conducting, analyzing, and interpreting sets of experiments aimed at making sound decisions without incurring a too high cost or taking too much time ŌĆó Qualitative and quantitative variables ’ā× optimization objective ŌĆó Selection of the minimal number of samples ŌĆó Non-linear / linear multidimensional regression models ŌĆó Increasing sampling for an optimal prediction model ŌĆó even combining qualitative and quantitative (measureable) variables MULTIVARIATE STATISTICS: DoE
- 18. ŌĆó Problem formulation ŌĆó Aim (reproducible and measurable) ŌĆó Relevant factors (qualitative and quantitative) ŌĆó Screening design ŌĆó Selection of levels for each factor ŌĆó Experiments (no. of samples) ŌĆó Analysis of the raw data ŌĆó Data analysis (Pareto, regression, etc.) ŌĆó Optimization & Robustness studies MULTIVARIATE STATISTICS: DoE BASICS
- 19. 1 ŌĆō Sparkle detection distance vs. metallic pigment size & shape 2 ŌĆō Sparkle detection distance vs. concentration, achromatic background, illuminance level & pigment type 3 ŌĆō Sparkle detection distance vs. colored background 4 ŌĆō Color matching vs. silver finishing process on a coated plastic 5 ŌĆō Gonio-appearance of 3D printed parts vs. 3D printing technology and its sub ŌĆō processes FIVE DoE EXAMPLES
- 20. ŌĆó Relevance and interplay of colored backgrounds by CIE-L*C*abhab ŌĆó Fixed structural and environmental data (factors) ŌĆó Color mix: variable solid pigment + fixed effect pigment ŌĆó L*: 3 levels ŌĆó C*ab: 3 levels ŌĆó hab: 4 levels SPARKLE DETECTION DISTANCE Complete multi-level factorial table of experiments (samples) Sample no. C L h Sample description [Hue / Lightness / Chroma] 1 0 1 1,00 RED / LIGHT / MEDIUM 2 1 -1 1,00 RED / DARK / STRONG ŌĆ” ŌĆ” ŌĆ” ŌĆ” ŌĆ” 13 -1 1 -1,00 GREEN / LIGHT / WEAK 14 -1 -1 0,33 BLUE / DARK/ WEAK ŌĆ” ŌĆ” 23 0 1 0,33 BLUE / LIGHT / MEDIUM 24 0 -1 -0,33 YELLOW / DARK / MEDIUM ŌĆ” ŌĆ” ŌĆ” ŌĆ” ŌĆ” 34 1 0 1,00 RED / GRAY / STRONG 35 0 0 0,33 BLUE / GRAY / MEDIUM 36 -1 1 1,00 RED / LIGHT / WEAK
- 21. ŌĆó Goal: color matching (DEab = 0), L* = 82 , & maximum transparency ŌĆó Initial DoE proposal: Taguchi L16 (215-11) Matrix, before analysis COLOR MATCH vs. SILVER FINISHING Worksheet MEASURED RESPONSES N┬║ experim. Material PVD Thickness PVD Conc. Topcoat Topcoat Robot Basecoat Basecoat Robot DEab L* Transparency (T) 1 Metal A Low Low Low translucent white Low Low Low 2 Metal B High High High 3 High Low 4 Metal A High Low Low 5 Metal C Low High translucent white 6 Metal D Low High High 7 High High 8 Metal C Low Low Low 9 Metal A High Low High 10 Metal B High High Low 11 High Low 12 Metal A High Low High 13 Metal C Low Low translucent white 14 Metal D Low High Low 15 High High 16 Metal C Low Low High
- 22. ŌĆó Can 3D printed parts for cars (body or interior) equal or better color & texture without losing phys ŌĆō chem performance? ŌĆó DoE aims: high sparkle, flop, chroma, colorfastness, etc. ŌĆó Factors: ŌĆó Qualitative: ŌĆó Technologies: FFF or FDM, MultiJet Fusion, ColorJet, Powder-bed, living AM, etc. ŌĆó Materials: (bio)polymers, pigments, additives, process sequence, etc. ŌĆó Quantitative: ŌĆó Temperature, irradiation, speed, layer height, infill, head size, etc. GONIO-APPEARANCE IN 3D PRINTED PARTS
- 23. ŌĆó FFF experiment table (Taguchi L9): PLA fixed, simple interactions ŌĆó Head size (mm): 3 levels ŌĆó 100, 200 & 300 ŌĆó Speed (mm/s): 3 levels ŌĆó 20, 40 & 60 ŌĆó Infill (%): 3 levels ŌĆó 0, 20 & 100 ŌĆó Color: 3 levels ŌĆó Without pigment ŌĆó Solid or special-effect pigment GONIO-APPEARANCE IN 3D PRINTED PARTS Sample no. HEAD SPEED INFILL COLOR 1 1 3 2 3 2 3 2 2 1 3 1 2 3 2 4 3 1 3 3 5 3 3 1 2 6 2 1 2 2 7 2 3 3 1 8 1 1 1 1 9 2 2 1 3 Plane printed samples for measuring flop
- 24. ŌĆó FFF experiment tables: ŌĆó Complete multi-level factorial: ŌĆó All previous factors with 2 levels, except color ’ā× set = 24, all possible interactions ŌĆó Multi-level factorial + D ŌĆō optimal design ŌĆó Only speed with 2 levels ’ā× complete set = 54, but optimally reduced to 21 ŌĆó Multi-level factorial + D ŌĆō optimal design: ŌĆó All factors with 3 levels + new factor (polymer: ABS & PLA) ’ā× complete set = 162, but optimally reduced to 21, and simple interactions well detected ŌĆó Multi-level V2 factorial + D ŌĆō optimal design: ŌĆó Only speed and polymer with 2 levels ’ā× from 108 to 21, quadratic interactions GONIO-APPEARANCE IN 3D PRINTED PARTS
- 25. ’é¦ Hybrid multi ŌĆō scale approach for visual appearance of materials applied successfully in automotive can be extended to other industries as ceramics, coatings, cosmetics, plastics, printing, etc. ’é¦ Structural elements (pigments, etc.), advanced instrumental techniques, visual and instrumental correlation methods, statistics (DoE, etc.), can save time and money to implement new color & texture quality controls successfully, etc., and even to make easy new competitive advantages for companies. CONCLUSIONS
- 26. COUNT ON US
- 27. Pro-active Management of Visual Appearance of Products: from the Automotive Sector to other Industries Fco M. Mart├Łnez-Verd├║ Color & Vision Group: http://web.ua.es/en/gvc University of Alicante (Spain) verdu@ua.es


![’é¦ Processes: why? how? when?
’é¦ Design and production easy to be managed
’é¦ Feasibility & stability of original product model (std. or master)
’é¦ Ease for creativity & innovation
’é¦ Repeatability & accuracy of batches
’é¦ Measure to save time & money:
’é¦ Comparison with error range ’ā× TOLERANCE
’é¦ Multi ŌĆō scale process: nano/micro ’é½ visual
’é¦ From bottom ŌĆō up approach ’ā× top ŌĆō down
’é¦ Predictive model of pro ŌĆō active management by:
’é¦ Statistical design of experiments (DoE)
’é¦ Regression models
MULTIVARIATE STATISTICS
DEAUDI2000 < ’ā¢ 2 = 1.41 OK
DEAUDI2000 ’āÄ [’ā¢ 2 , ’ā¢ 3 = 1.73] cOK
DEAUDI2000 > 1.73 FAIL](https://image.slidesharecdn.com/pro-activemanagementofvisualappearanceofproducts-171004160036/85/Pro-active-management-of-visual-appearance-of-products-16-320.jpg)


![ŌĆó Relevance and interplay of colored backgrounds by CIE-L*C*abhab
ŌĆó Fixed structural and environmental data (factors)
ŌĆó Color mix: variable solid pigment + fixed effect pigment
ŌĆó L*: 3 levels
ŌĆó C*ab: 3 levels
ŌĆó hab: 4 levels
SPARKLE DETECTION DISTANCE
Complete multi-level factorial table of experiments (samples)
Sample no. C L h Sample description [Hue / Lightness / Chroma]
1 0 1 1,00 RED / LIGHT / MEDIUM
2 1 -1 1,00 RED / DARK / STRONG
ŌĆ” ŌĆ” ŌĆ” ŌĆ” ŌĆ”
13 -1 1 -1,00 GREEN / LIGHT / WEAK
14 -1 -1 0,33 BLUE / DARK/ WEAK
ŌĆ” ŌĆ”
23 0 1 0,33 BLUE / LIGHT / MEDIUM
24 0 -1 -0,33 YELLOW / DARK / MEDIUM
ŌĆ” ŌĆ” ŌĆ” ŌĆ” ŌĆ”
34 1 0 1,00 RED / GRAY / STRONG
35 0 0 0,33 BLUE / GRAY / MEDIUM
36 -1 1 1,00 RED / LIGHT / WEAK](https://image.slidesharecdn.com/pro-activemanagementofvisualappearanceofproducts-171004160036/85/Pro-active-management-of-visual-appearance-of-products-20-320.jpg)


