PROCESS CAPABILITY
Download as pptx, pdf8 likes9,332 views

The document discusses process capability and defines key terms related to process capability. It provides the standard formula for process capability using 6 sigma and explains how process capability is compared to specification limits. It then discusses different process capability indices including Cp, Cpk, and Cpm. It explains how these indices measure both potential and actual process capability. The document also discusses limitations of the Cp index and the use of Cpk to address process centering. It describes how to calculate confidence intervals for process capability ratios and discusses some key process performance metrics.
![Limitation of Cp Index & To Generate Cpk
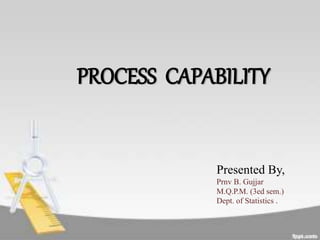
The Cp index is limited in its use since it doesnÔÇÖt address the centering of the process
Relative to he specification limit. For that reason ,the Cpk was developed and
I is defind as
Cpk = min[ Cpku,Cpkl]
Where, Cpku= =Upper Process Capability Index
Cpkl= =Lower Process Capability Index
If Cp = Cpk the process is center at the midpoint of the specifications.
Cpk <Cp the process is off center. The magnitude of Cpk relative to Cp is a direct
measure of how off-centre the process is operating.](https://image.slidesharecdn.com/1890c7cf-146d-4e07-abab-a3b540aceae7-151011161559-lva1-app6892/85/PROCESS-CAPABILITY-9-320.jpg)
![Cpm
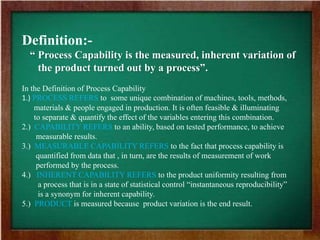
ÔÇó You are almost never going to use
this, but for completeness..
ÔÇó In some processes you will not
target the center point.
ÔÇó Example cutting impellers you
want to cut an impeller diameter
between 196 and 200 mm
ÔÇó It may be cheaper to bias the
target cut towards say 199mm
instead of 198mm
ÔÇó So in this case if we target
199mm we want to measure
the process against the target
instead of the center point
Cpm = Cp/[1+((Xbar-T)^2/s^2)]; Where T is the
target value. Explained above.](https://image.slidesharecdn.com/1890c7cf-146d-4e07-abab-a3b540aceae7-151011161559-lva1-app6892/85/PROCESS-CAPABILITY-15-320.jpg)

PROCESS CAPABILITY
- 1. PROCESS CAPABILITY Presented By, Prnv B. Gujjar M.Q.P.M. (3ed sem.) Dept. of Statistics .
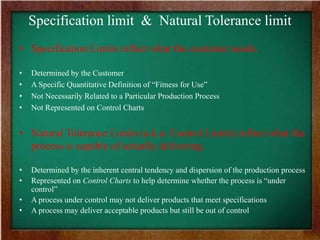
- 2. Definition:- ÔÇ£ Process Capability is the measured, inherent variation of the product turned out by a processÔÇØ. In the Definition of Process Capability 1.) PROCESS REFERS to some unique combination of machines, tools, methods, materials & people engaged in production. It is often feasible & illuminating to separate & quantify the effect of the variables entering this combination. 2.) CAPABILITY REFERS to an ability, based on tested performance, to achieve measurable results. 3.) MEASURABLE CAPABILITY REFERS to the fact that process capability is quantified from data that , in turn, are the results of measurement of work performed by the process. 4.) INHERENT CAPABILITY REFERS to the product uniformity resulting from a process that is in a state of statistical control ÔÇ£instantaneous reproducibilityÔÇØ is a synonym for inherent capability. 5.) PRODUCT is measured because product variation is the end result.
- 3. Standardize formula for Process Capability # Process Capability = +3¤â or -3¤â ( a total of 6¤â) Where, ¤â shows the standard deviation of Process under a state of statistical control. # If the process is centered at the nominal specification & follows a normal probability distribution ,99.73% of production will fall within +3¤â or -3¤â of the normal specification. # Some industrial process operate under a state of statistical control. For such processes, The computed process capability of 6¤â can be compared directly to specification limits, A judgments of adequacy can be made. # A process is said to be capable when the output always conforms to the process specifications.
- 4. Specification limit & Natural Tolerance limit ÔÇó Specification Limits reflect what the customer needs. ÔÇó Determined by the Customer ÔÇó A Specific Quantitative Definition of ÔÇ£Fitness for UseÔÇØ ÔÇó Not Necessarily Related to a Particular Production Process ÔÇó Not Represented on Control Charts ÔÇó Natural Tolerance Limits (a.k.a. Control Limits) reflect what the process is capable of actually delivering. ÔÇó Determined by the inherent central tendency and dispersion of the production process ÔÇó Represented on Control Charts to help determine whether the process is ÔÇ£under controlÔÇØ ÔÇó A process under control may not deliver products that meet specifications ÔÇó A process may deliver acceptable products but still be out of control
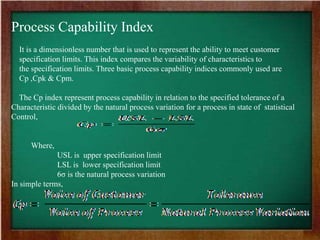
- 5. Process Capability Index It is a dimensionless number that is used to represent the ability to meet customer specification limits. This index compares the variability of characteristics to the specification limits. Three basic process capability indices commonly used are Cp ,Cpk & Cpm. The Cp index represent process capability in relation to the specified tolerance of a Characteristic divided by the natural process variation for a process in state of statistical Control, Where, USL is upper specification limit LSL is lower specification limit 6¤â is the natural process variation In simple terms,
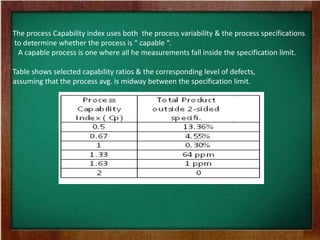
- 6. The process Capability index uses both the process variability & the process specifications to determine whether the process is ÔÇ£ capable ÔÇ£. A capable process is one where all he measurements fall inside the specification limit. Table shows selected capability ratios & the corresponding level of defects, assuming that the process avg. is midway between the specification limit.
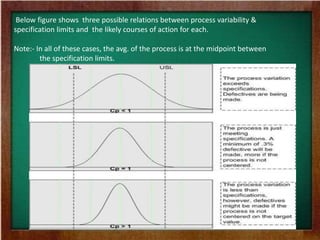
- 7. Below figure shows three possible relations between process variability & specification limits and the likely courses of action for each. Note:- In all of these cases, the avg. of the process is at the midpoint between the specification limits.
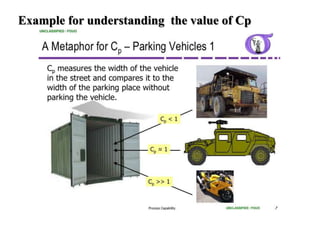
- 8. Example for understanding the value of Cp
- 9. Limitation of Cp Index & To Generate Cpk The Cp index is limited in its use since it doesnÔÇÖt address the centering of the process Relative to he specification limit. For that reason ,the Cpk was developed and I is defind as Cpk = min[ Cpku,Cpkl] Where, Cpku= =Upper Process Capability Index Cpkl= =Lower Process Capability Index If Cp = Cpk the process is center at the midpoint of the specifications. Cpk <Cp the process is off center. The magnitude of Cpk relative to Cp is a direct measure of how off-centre the process is operating.
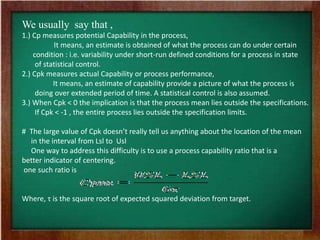
- 10. We usually say that , 1.) Cp measures potential Capability in the process, It means, an estimate is obtained of what the process can do under certain condition : i.e. variability under short-run defined conditions for a process in state of statistical control. 2.) Cpk measures actual Capability or process performance, It means, an estimate of capability provide a picture of what the process is doing over extended period of time. A statistical control is also assumed. 3.) When Cpk < 0 the implication is that the process mean lies outside the specifications. If Cpk < -1 , the entire process lies outside the specification limits. # The large value of Cpk doesnÔÇÖt really tell us anything about the location of the mean in the interval from Lsl to Usl One way to address this difficulty is to use a process capability ratio that is a better indicator of centering. one such ratio is Where, ¤ä is the square root of expected squared deviation from target.
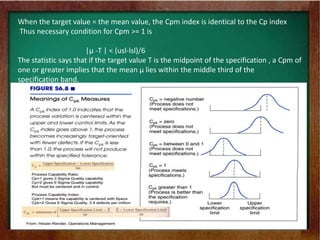
- 11. When the target value = the mean value, the Cpm index is identical to the Cp index Thus necessary condition for Cpm >= 1 is |┬Á -T | < (usl-lsl)/6 The statistic says that if the target value T is the midpoint of the specification , a Cpm of one or greater implies that the mean ┬Á lies within the middle third of the specification band.
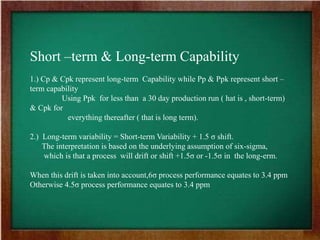
- 12. Short ÔÇôterm & Long-term Capability 1.) Cp & Cpk represent long-term Capability while Pp & Ppk represent short ÔÇô term capability Using Ppk for less than a 30 day production run ( hat is , short-term) & Cpk for everything thereafter ( that is long term). 2.) Long-term variability = Short-term Variability + 1.5 ¤â shift. The interpretation is based on the underlying assumption of six-sigma, which is that a process will drift or shift +1.5¤â or -1.5¤â in the long-erm. When this drift is taken into account,6¤â process performance equates to 3.4 ppm Otherwise 4.5¤â process performance equates to 3.4 ppm
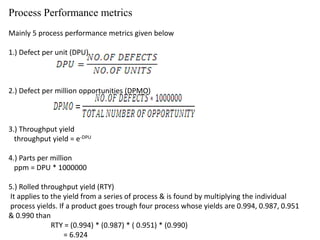
- 13. Process Performance metrics Mainly 5 process performance metrics given below 1.) Defect per unit (DPU) 2.) Defect per million opportunities (DPMO) 3.) Throughput yield throughput yield = e-DPU 4.) Parts per million ppm = DPU * 1000000 5.) Rolled throughput yield (RTY) It applies to the yield from a series of process & is found by multiplying the individual process yields. If a product goes trough four process whose yields are 0.994, 0.987, 0.951 & 0.990 than RTY = (0.994) * (0.987) * ( 0.951) * (0.990) = 6.924
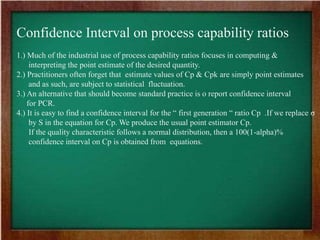
- 14. Confidence Interval on process capability ratios 1.) Much of the industrial use of process capability ratios focuses in computing & interpreting the point estimate of the desired quantity. 2.) Practitioners often forget that estimate values of Cp & Cpk are simply point estimates and as such, are subject to statistical fluctuation. 3.) An alternative that should become standard practice is o report confidence interval for PCR. 4.) It is easy to find a confidence interval for the ÔÇ£ first generation ÔÇ£ ratio Cp .If we replace ¤â by S in the equation for Cp. We produce the usual point estimator Cp. If the quality characteristic follows a normal distribution, then a 100(1-alpha)% confidence interval on Cp is obtained from equations.
- 15. Cpm  You are almost never going to use this, but for completeness..  In some processes you will not target the center point.  Example cutting impellers you want to cut an impeller diameter between 196 and 200 mm  It may be cheaper to bias the target cut towards say 199mm instead of 198mm  So in this case if we target 199mm we want to measure the process against the target instead of the center point Cpm = Cp/[1+((Xbar-T)^2/s^2)]; Where T is the target value. Explained above.