Product Management - Personas + Data
- 1. Pivotal Labs Personas & Data Daniel Kamerling
- 2. as a company grows, the number of users increases this often results in a decline in the clarity of personas
- 4. A persona might look like this... Laura Quote: ŌĆ£I want to stay connected to my friends back home.ŌĆØ About: A sophomore at an out-of- state college where she is studying molecular biology on a football scholarship. Likes: Starbucks, pre-med classes, the smell of fresh grass Pain Points: Constantly juggling her schedule, friends are too far for a bus and a plane is too expensive.
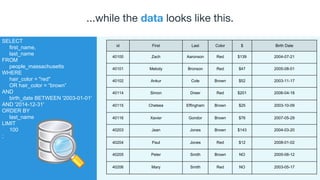
- 5. ...while the data looks like this. SELECT first_name, last_name FROM people_massachusetts WHERE hair_color = "red" OR hair_color = ŌĆ£brownŌĆØ AND birth_date BETWEEN '2003-01-01' AND '2014-12-31' ORDER BY last_name LIMIT 100 ; id First Last Color $ Birth Date 40100 Zach Aaronson Red $139 2004-07-21 40101 Melody Bronson Red $47 2005-08-01 40102 Ankur Cole Brown $52 2003-11-17 40114 Simon Dreer Red $201 2006-04-18 40115 Chelsea Effingham Brown $25 2003-10-09 40116 Xavier Gondor Brown $76 2007-05-29 40203 Jean Jones Brown $143 2004-03-20 40204 Paul Jones Red $12 2008-01-02 40205 Peter Smith Brown NO 2005-06-12 40206 Mary Smith Red NO 2003-05-17
- 6. How do we scale insight from personas and act upon data from users?
- 7. Persona Informed Segmentation A persona informed data feedback loop Research ŌåÆ Personas ŌåÆ Features ŌåÆ Launch ŌåÆ Data ŌåÆ Segmentation The gap between research and reality prompts the questions that seed the next iteration of user centered design. ╬ö Product
- 8. LETŌĆÖS DO A CASE STUDY!
- 9. Personas Lynda - New Chef Cook times < 30min Simple recipes Healthy ingredients Jamie - Family Chef Prefers crock pot Large dishes (pasta, etc) Simple ingredients Tyson - Hobby Chef Quality > Time Complex recipes Exotic ingredients
- 10. Product Launch! ŌĆ” ŌĆ” click ŌĆ” click, click ŌĆ” click, click, click, click, click, click, click, click, click, click, click, click,
- 11. QUESTION Who is using our website? How do they compare to our personas? What do we build next???
- 12. ANSWER Check the data. Birthday, saved recipes, viewed recipes, log-in frequency, # of comments, subscriptions, social media shares, etcŌĆ”
- 13. 1. Correlation Recipes < 30 min Chicken Age 35-55 Post to Facebook >5 saved Blue = Positively Correlated Orange = Negatively Correlated Thickness = Strength of Correlation Select a set of factors from the data that are important to understanding the users
- 14. Data S1 S2 S3 Recipe Cook Time 0.26 0.24 -0.33 Veggie <--> Meat -0.28 -0.08 -0.06 Posting 0.09 0.57 0.39 Saved Recipes -0.15 -0.45 -0.23 2. Modeling Important factors ŌŚÅ Difficult ŌŚÅ Posting ŌŚÅ Age 35 to 55 ...segments represented by all data points. Only consider the most significant correlations Via math transformation we can obtain... Data Model
- 15. S1 S2...S11 S12 Cook Time < 30 min Very Few Log-ins Kale LOTS of Comments Shares on Facebook Easy Recipes 3. Significance Not all segments are meaningful WTF?!?Might be Lynda??? Representative Segments
- 17. Persona-User Gap Analysis compare attributes of personas gathered during design with factors of segments gathered from usage data
- 18. Lynda - New Chef Cook times < 30min Simple recipes Healthy ingredients Jamie - Family Chef Prefers crock pot Large dishes (pasta, etc) Simple ingredients Tyson - Hobby Chef Quality > Time Complex recipes Exotic ingredients S1 - I <3 Salad Cook times < 30min Kale in most dishes Shares on Facebook S2 - On the Go Only views on mobile Never saves recipes Doubles # of servings S3 - Aspirational Views difficult recipes but doesnŌĆÖt save them Highly active on forums Looks good! LetŌĆÖs add more salads and increase our Facebook advertising budget. Is this engagement healthy? Maybe we need better instructions or to add videos? What is going on here??? Personas Segments Insights
- 19. Results Gaps provide a conversation starter for future research This is NOT reflect on the quality of personas This IS a tool for testing, feedback, and constant iteration
- 20. RECIPE PERSONAS INSTRUMENTATIONREGISTRATION MODELING SYNTHESIS & GAP ANALYSIS
- 21. TAKEAWAY Questions to ask during an engagement: What data is important? What data are we collecting? How do we analyze the data? What do we do with the data?
- 23. TAKEAWAY - DETAILS P D E DS Understand and communicate the value of targeting for the product Leverage the roadmap to create design / data feedback loops Inform the team early about what is important to track Leverage the team to help you find users and interesting behaviors Instrument all the things! Incorporate the concept of ŌĆ£user typeŌĆØ for routing where appropriate for testing and user flow Recommend models for performing segmentation Think ahead about design for real-time prediction
- 24. How do we identify personas when we donŌĆÖt even know where to start? Segment first to narrow the field.
- 25. K-FACTOR & DENDROGRAMS DonŌĆÖt try this at home! Ask a friendly, neighborhood Data Scientist for help =)


