際際滷

際際滷Share a Scribd company logo
Cafeteria Analysis
       Quality Management  Master in Economics


Cristina Alcaide Mu単oz
Carmen Olea Villoslada
Federica Qualizza
Desir辿e Su叩rez Santana
Index
 Introduction
 Stratification
 General frequency
 Pareto Chart
 Frequent users
 Type service frequency
 Correlations
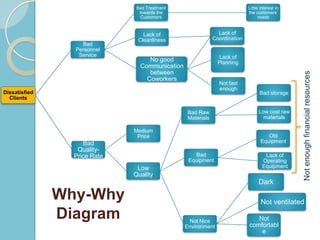
 Why-Why Diagram
 Ideas for improvements
Introduction
 The purpose of this study is to know
  customer satisfaction and provide
  some ideas to improve the cafeteria
  service.
 The questionnaire
Introduction
   Likert scale
        1 Strongly disagree
        2 Disagree
        3 Neither disagree nor agree
        4 Agree
        5 Strongly agree


   Customers are satisfied with the cafeteria
    service.

   The cafeteria receives few complaints.
Stratification
The cafeteria receives few complaints.
             Type of service                          Years in the
   14%                  Breakfast                      universty
                                                    11%
                        Lunch
 21%            50%                                              1 to 2 years
       15%                                    34%          55%
                        Afternoon                                3 to 4 years
                        snack
                                                                 5 to 10 years
                        Others


                                    Working

                                      15%

                                                     Yes

                            85%                      No
General frequency
Pareto Chart
Frequent users
Type service frequency
                           OTRO


                       MIERENDA


                    ALMUERZO


                    DESAYUNO


                                    0        20       40        60

                                    DESAYUN ALMUERZ MIEREND
                                                              OTRO
                                       O       O       A
           Bad quality/price rate       15        2    7       1
           no good comunication
             between workers            9         2    3       1

           Not clean                    8         0    5       0
           People are not treated
                   well                 6         0    4       1

           Service is not fast          4         0    2       1
Correlations (I): table
                                                                                                            Commu-
                                              variables             Speed    Customer Quality/   Cleanli-   nication
                                                                             Treatment Price      ness      between
                                                                                       Ratio                workers


                                                 Correlation
                                                                    1,000      ,639**   ,518**    ,465**     ,603**
                                                 Coefficient
                                  Speed
                                                 Sig. (bilateral)     .        ,000     ,000      ,000        ,000
                                                 N                   232       231       232       231        231
                                                 Correlation
                                                                    ,639**     1,000    ,479**    ,548**     ,625**
                                Customer         Coefficient
                                treatment        Sig. (bilateral)   ,000         .      ,000      ,000        ,000
                                                 N                   231       233       233       232        232
                                                 Correlation
                                                                    ,518**     ,479**   1,000     ,541**     ,506**
                              Quality/Price      Coefficient
    Rho de Spearman
                                 ratio           Sig. (bilateral)   ,000       ,000       .       ,000        ,000
                                                 N                   232       233       234       233        233
                                                 Correlation
                                                                    ,465**     ,548**   ,541**    1,000      ,626**
                                                 Coefficient
                               Cleanliness
                                                 Sig. (bilateral)   ,000       ,000     ,000        .         ,000
                                                 N                   231       232       233       233        232
                                                 Correlation
                             Communication Coefficient              ,603**     ,625**   ,506**    ,626**     1,000
                                 between
                                 workers         Sig. (bilateral)   ,000       ,000     ,000      ,000         .
                                                 N                   231       232       233       232        233
**. The correlation is significant at 0.01 (bilateral)
University
             Correlations (I): table                                   Years

                                           Correlation Coefficient     1,000
                      University Years     Sig. (bilateral)              .
                                           N                            247
                                           Correlation Coefficient     ,150*
                           Speed           Sig. (bilateral)            ,024
                                           N                            226
                                           Correlation Coefficient     ,101
                    Customer Treatment     Sig. (bilateral)            ,129
                                           N                            227

Spearmans Ratio                           Correlation Coefficient     ,107
                     Quality/Price Rate
                                           Sig. (bilateral)            ,106
                                           N                            228
                                           Correlation Coefficient     ,202**
                        Cleanliness        Sig. (bilateral)            ,002
                                           N                            227
                                           Correlation Coefficient     ,123
                                           Sig. (bilateral)            ,065
                   Communication between
                         Workers
                                           N                            227
INTERACTIONS                              RELATIONSHIP

             Correlations          X Negative relationship                    Perfect Correlation
                                   XX Positive relationship                   Very Strong Correlation
              (II): matrix                                                    Strong Correlation
                                                                             率 Moderate Correlation
                                                                             隆 Weak Correlation
                                                                              Not Correlation


                                                                    xx

                                                       xx                                   xx

                                   xx

                         xx                                                                                 xx
                                Customer          Quality/Price   Cleanli- Communication between         University
      VARIABLES         Speed   treatment            Rate          ness          workers                   Years

        Speed              .                               率         率                                         隆

  Customer treatment                   .                   率         率                                         

  Quality/Price Rate      率             率                   .         率                          率               

      Cleanliness         率             率                   率            .                                      隆
Communication between
      workers                                             率                                   .               

   University Years       隆                                        隆                                          .
Bad Treatment                                 Little interest in
                                towards the                                  the customers
                                 Customers                                         needs


                                 Lack of                       Lack of
                                                                Lack of
                               Cleanliness                   Coordination
                                                              Coordination
                   Bad
                 Personnel
                  Service                                       Lack of
                                   No good                     Planning
                                Communication
                                   between


                                                                                                  Not enough financial resources
                                  Coworkers
                                                                Not fast
                                                                enough
Dissatisfied                                                                       Bad storage
  Clients

                                                 Bad Raw                           Low cost raw
                                                 Materials                           materials

                              Medium
                               Price                                                   Old
                    Bad                                                             Equipment
                  Quality-
                 Price Rate                         Bad                               Lack of
                                                 Equipment                           Operating
                               Low                                                   Equipment
                              Quality
                                                                                   Dark

               Why-Why                                                              Not ventilated

               Diagram                           Not Nice                       Not
                                                Environment                  comfortabl
                                                                                 e
Ideas for improvements
   Cleaning right after the customer has left the
    table
   Better relationships with suppliers/new suppliers
   Investment in new equipment
   More flexibility
   Better communication
   More interest in customers needs and opinions
   Another spatial distribution
   Customer service courses
Thank you for your attention!

More Related Content

Quality Management - Cafeteria Analysis UGR

  • 1. Cafeteria Analysis Quality Management Master in Economics Cristina Alcaide Mu単oz Carmen Olea Villoslada Federica Qualizza Desir辿e Su叩rez Santana
  • 2. Index Introduction Stratification General frequency Pareto Chart Frequent users Type service frequency Correlations Why-Why Diagram Ideas for improvements
  • 3. Introduction The purpose of this study is to know customer satisfaction and provide some ideas to improve the cafeteria service. The questionnaire
  • 4. Introduction Likert scale 1 Strongly disagree 2 Disagree 3 Neither disagree nor agree 4 Agree 5 Strongly agree Customers are satisfied with the cafeteria service. The cafeteria receives few complaints.
  • 5. Stratification The cafeteria receives few complaints. Type of service Years in the 14% Breakfast universty 11% Lunch 21% 50% 1 to 2 years 15% 34% 55% Afternoon 3 to 4 years snack 5 to 10 years Others Working 15% Yes 85% No
  • 9. Type service frequency OTRO MIERENDA ALMUERZO DESAYUNO 0 20 40 60 DESAYUN ALMUERZ MIEREND OTRO O O A Bad quality/price rate 15 2 7 1 no good comunication between workers 9 2 3 1 Not clean 8 0 5 0 People are not treated well 6 0 4 1 Service is not fast 4 0 2 1
  • 10. Correlations (I): table Commu- variables Speed Customer Quality/ Cleanli- nication Treatment Price ness between Ratio workers Correlation 1,000 ,639** ,518** ,465** ,603** Coefficient Speed Sig. (bilateral) . ,000 ,000 ,000 ,000 N 232 231 232 231 231 Correlation ,639** 1,000 ,479** ,548** ,625** Customer Coefficient treatment Sig. (bilateral) ,000 . ,000 ,000 ,000 N 231 233 233 232 232 Correlation ,518** ,479** 1,000 ,541** ,506** Quality/Price Coefficient Rho de Spearman ratio Sig. (bilateral) ,000 ,000 . ,000 ,000 N 232 233 234 233 233 Correlation ,465** ,548** ,541** 1,000 ,626** Coefficient Cleanliness Sig. (bilateral) ,000 ,000 ,000 . ,000 N 231 232 233 233 232 Correlation Communication Coefficient ,603** ,625** ,506** ,626** 1,000 between workers Sig. (bilateral) ,000 ,000 ,000 ,000 . N 231 232 233 232 233 **. The correlation is significant at 0.01 (bilateral)
  • 11. University Correlations (I): table Years Correlation Coefficient 1,000 University Years Sig. (bilateral) . N 247 Correlation Coefficient ,150* Speed Sig. (bilateral) ,024 N 226 Correlation Coefficient ,101 Customer Treatment Sig. (bilateral) ,129 N 227 Spearmans Ratio Correlation Coefficient ,107 Quality/Price Rate Sig. (bilateral) ,106 N 228 Correlation Coefficient ,202** Cleanliness Sig. (bilateral) ,002 N 227 Correlation Coefficient ,123 Sig. (bilateral) ,065 Communication between Workers N 227
  • 12. INTERACTIONS RELATIONSHIP Correlations X Negative relationship Perfect Correlation XX Positive relationship Very Strong Correlation (II): matrix Strong Correlation 率 Moderate Correlation 隆 Weak Correlation Not Correlation xx xx xx xx xx xx Customer Quality/Price Cleanli- Communication between University VARIABLES Speed treatment Rate ness workers Years Speed . 率 率 隆 Customer treatment . 率 率 Quality/Price Rate 率 率 . 率 率 Cleanliness 率 率 率 . 隆 Communication between workers 率 . University Years 隆 隆 .
  • 13. Bad Treatment Little interest in towards the the customers Customers needs Lack of Lack of Lack of Cleanliness Coordination Coordination Bad Personnel Service Lack of No good Planning Communication between Not enough financial resources Coworkers Not fast enough Dissatisfied Bad storage Clients Bad Raw Low cost raw Materials materials Medium Price Old Bad Equipment Quality- Price Rate Bad Lack of Equipment Operating Low Equipment Quality Dark Why-Why Not ventilated Diagram Not Nice Not Environment comfortabl e
  • 14. Ideas for improvements Cleaning right after the customer has left the table Better relationships with suppliers/new suppliers Investment in new equipment More flexibility Better communication More interest in customers needs and opinions Another spatial distribution Customer service courses
  • 15. Thank you for your attention!