


More Related Content
Similar to Quantitative Research Design.pptx (20)
Recently uploaded (20)


Quantitative Research Design.pptx
- 1. Dr. Alok Kumar Gaurav Assistant Professor Department of Public Administration QUANTITATIVE RESEARCH DESIGN
- 2. Quantitative Research Design ŌĆó relates to the design of a research project which uses quantitative research methods. The design varies depending on the method used, which could be ŌĆó telephone interviews, ŌĆó face-to-face interviews, ŌĆó online surveys, or surveys by post for instance. ŌĆó Other methodologies include SMS / Test Message surveys, ŌĆó or physical counts.
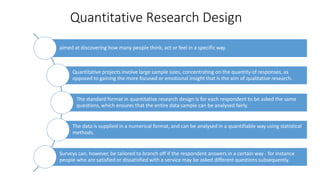
- 3. Quantitative Research Design aimed at discovering how many people think, act or feel in a specific way. Quantitative projects involve large sample sizes, concentrating on the quantity of responses, as opposed to gaining the more focused or emotional insight that is the aim of qualitative research. The standard format in quantitative research design is for each respondent to be asked the same questions, which ensures that the entire data sample can be analysed fairly. The data is supplied in a numerical format, and can be analysed in a quantifiable way using statistical methods. Surveys can, however, be tailored to branch off if the respondent answers in a certain way - for instance people who are satisfied or dissatisfied with a service may be asked different questions subsequently.
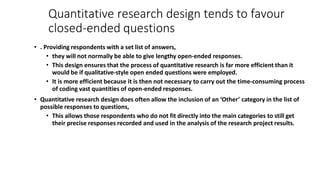
- 4. Quantitative research design tends to favour closed-ended questions ŌĆó . Providing respondents with a set list of answers, ŌĆó they will not normally be able to give lengthy open-ended responses. ŌĆó This design ensures that the process of quantitative research is far more efficient than it would be if qualitative-style open ended questions were employed. ŌĆó It is more efficient because it is then not necessary to carry out the time-consuming process of coding vast quantities of open-ended responses. ŌĆó Quantitative research design does often allow the inclusion of an ŌĆśOtherŌĆÖ category in the list of possible responses to questions, ŌĆó This allows those respondents who do not fit directly into the main categories to still get their precise responses recorded and used in the analysis of the research project results.
- 5. QUANTITATIVE Quantitative research ŌĆó determine the relationship between one thing (an independent variable) and another (a dependent or outcome variable) in a population. Quantitative research designs ŌĆó descriptive (subjects usually measured once) ŌĆó experimental (subjects measured before and after a treatment).
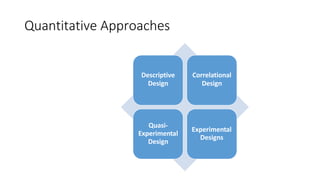
- 7. A Descriptive Design ŌĆó seeks to describe the current status of a variable or phenomenon. ŌĆó The researcher does not begin with a hypothesis, but typically develops one after the data is collected. ŌĆó Data collection is mostly observational in nature. A Correlational Design ŌĆó explores the relationship between variables using statistical analyses. ŌĆó it does not look for cause and effect and therefore, is also mostly observational in terms of data collection. A Quasi- Experimental Design ŌĆó (often referred to as Causal-Comparative) seeks to establish a cause-effect relationship between two or more variables. ŌĆó The researcher does not assign groups and does not manipulate the independent variable. ŌĆó Control groups are identified and exposed to the variable. ŌĆó Results are compared with results from groups not exposed to the variable. Experimental Designs, ŌĆó often called true experimentation, use the scientific method to establish cause- effect relationship among a group of variables in a research study. ŌĆó Researchers make an effort to control for all variables except the one being manipulated (the independent variable). ŌĆó The effects of the independent variable on the dependent variable are collected and analyzed for a relationship.
- 9. DATA ANALYSIS FOR QUANTITATIVE RESEARCH Descriptive Statistics Inferential Statistics
- 10. Descriptive
- 12. Quantitative Data ŌĆó Obtained when the variable being studied is measured along a scale that indicates how much of the variable present. ŌĆó Reported in terms of scores. ŌĆó Higher scores indicate that more of the variable ŌĆó Ex: The amount of money spent on sports equipment by various schools Categorical Data ŌĆó Simply indicate the total number of objects, individuals or events a particular category. ŌĆó Ex: The representation of each ethnic group in a school.
- 13. Raw Scores ŌĆó Initial score obtained ŌĆó Difficult to interpret and it has a little meaning. Derived Scores ŌĆó Obtained by taking raw scores and converting them into more useful scores. Age and Grade-level Equivalents ŌĆó Tell us of what age or grade an individual score is typical. Percentile Ranks ŌĆó Refers to percentage of individuals scoring at or below a given raw score Standard Scores ŌĆó Provide an other means of indicating how one individual compares to other individuals in a group
- 14. ŌĆó Frequency Polygons ŌĆó Skewed Polygons ŌĆó Histograms and Stem-Leaf Plots ŌĆó The Normal Curve ŌĆó Averages ŌĆó Spreads ŌĆó Standard Scores and the Normal Curve ŌĆó Correlation
- 15. ŌĆó When the data are simply listed in no apparent order, it is difficult to tell. ŌĆó We must put the information into some sort of order. ŌĆó Frequency distribution ŌĆō list the scores in rank order from high to low (Table 10.2) ŌĆó Grouped frequency distribution ŌĆō information grouped into intervals and quite informative (Table 10.3) ŌĆó Frequency polygon ŌĆō present the data in graph (graphical display). 64, 27, 61, 56, 52, 51, 34, 17, 27, 17, 24, 64, 31, 29, 31, 29, 29, 31, 31, 59, 56, 31, 27, 17 Listed below are the scores of a group of students on mid semester biology test.
- 17. Skewed Positively Skewed Polygon ŌĆó The tail of the distribution trails off to the right, in the direction of the higher scores values. Negatively Skewed Polygon ŌĆó The longer tail of the distribution goes off to the left, in the direction of the lower scores values.
- 18. & Histogram is a bar graph used to display quantitative data at the interval or ratio level of measurement. Arranged from left to right on the horizontal axis. At the intersection of the two axis is always zero. Steam-leaf plot is a display that organizes a set of data to show both in shape and distribution. Each data value is split into stem and leaf. The leaf usually the last digit of the number and the other digits to the left is stem. Ex: 149 leaf 9 stem 14
- 19. The ŌĆó The smooth curve not just connecting the series of dots, but rather showing a generalized distribution of scores that is not limited to one specific set of data. ŌĆó This smooth curves are known as distribution curves. ŌĆó When a distribution curve is normal, the large majority of the scores concentrated in the middle and the scores decrease in frequency far away from the middle. ŌĆó It is based on a precise mathematical equation. ŌĆó Useful for researchers.
- 20. Mod Median ŌĆó Is the point below and above which 50 percent of the scores in distribution fall (midpoint). 7, 6, 5, 4, 3, 2, 1 Mean ŌĆó It is determined by adding up all the scores and then dividing this sum by the total number of scores. ŌĆó Is the most frequent score in a distribution 25, 20, 19, 17, 16, 16, 16, 14, 14, 11,10, 9, 9 70, 74, 82, 86, 88, 90 ŌĆó Median is 84 the point halfway between the two middlemost scores. 52, 68, 74, 86, 95, 105 ŌĆó The mean score is 80.
- 21. ŌĆó Is the extent to which a distribution is stretched or squeezed. ŌĆó The two distributions differ in what statisticians call variability. Inter Quartile Range Overall Range Standard Deviation ŌĆó The most useful index of variability. ŌĆó A single number that represents the spread of a distribution. A B
- 23. Standard Scor&es T scores z scores A raw score that is exactly on the mean corresponds to a z score of zero. ŌĆó A raw score that is exactly one SD above the mean equals a z score of +1, while below the mean equals a z score of -1. ŌĆó Ex: Mean = 50, SD = 2 48 50 52 z score +2 z score +2
- 24. z scores Of course z scores are not always exactly one or two standard deviation away from the mean.
- 25. ŌĆó Convert the raw scores below the mean from negative to positive. ŌĆó One way to eliminate negative z scores and convert them to T scores. T scores = (z scores x 10) + mean
- 26. When two sets of data are strongly linked together we say they have a High Correlation. The word Correlation is made of Co- (meaning "together"), and Relation. Correlation is Positive when the values increase together, and. Correlation is Negative when one value decreases as the other increases. scatterplots A pictorial representation of the relationship between two quantitative variables.
- 27. INFERENTIAL STATISTICS Inferential statistics allow researchers to make inferences about a population based on findings (data they obtain) from a sample.
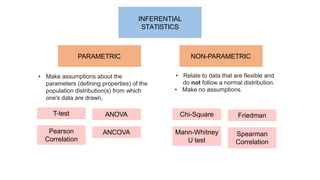
- 28. ŌĆó Relate to data that are flexible and do not follow a normal distribution. ŌĆó Make no assumptions. INFERENTIAL STATISTICS PARAMETRIC NON-PARAMETRIC ŌĆó Make assumptions about the parameters (defining properties) of the population distribution(s) from which one's data are drawn, T-test ANOVA Pearson Correlation ANCOVA Chi-Square Friedman Mann-Whitney U test Spearman Correlation
- 29. PARAMETRIC INFERENTIAL STATISTICS ŌĆó T-test is used to determine whether there is a significant difference between the means of two groups. ŌĆó Analysis of variance (ANOVA) is used to check if the means of two or more groups are significantly different from each other. ŌĆó Pearson's Correlation Coefficient is a measure of the strength of the association between the two variables.
- 30. NON-PARAMETRIC INFERENTIAL STATISTICS ŌĆó Chi square test is any statistical hypothesis test where the sampling distribution of the test statistic is a chi-squared distribution when the null hypothesis is true. ŌĆó The Mann-Whitney U test is used to compare differences between two independent groups when the dependent variable is either ordinal or continuous, but not normally distributed. ŌĆó The Friedman test is used to test for differences between groups when the dependent variable being measured is ordinal. ŌĆó The Spearman is often used to evaluate relationships involving ordinal variables.