Quasi experiment
•Download as PPSX, PDF•
2 likes•4,667 views

Quasi eksperimen adalah desain penelitian yang tidak memiliki penugasan acak dan kontrol penuh terhadap obyek, namun dapat menambahkan kelompok kontrol dan pengukuran sebelum dan sesudah untuk mengukur efek intervensi. Ada beberapa jenis desain quasi eksperimen seperti nonrandomized control group pretest-posttest design, counterbalanced design, one-group time-series design, dan control group time-series design.


Quasi experiment
- 1. Quasi Experiment Soetam Rizky Jujuk Ferdianto Edy Suprapto
- 2. Sebelum memulai……. • Eksperimen –Pre experiment –True experiment –Quasi experiment
- 3. Quasi Experiment Tidak memiliki penugasan random Disebut juga sebagai post-hoc research Tidak memiliki kendali penuh terhadap obyek Dilakukan jika sebelumnya telah ada naturally formed intact group
- 4. Strategi Keberhasilan Quasi Experiment menambahkan kelompok kontrol pengukuran sebelum dan sesudah implementasi yang didalamnya dilakukan intervensi bertahap memperkenalkan perlakuan terhadap kelompok obyek menambahkan prosedur terbalik terhadap tiap perlakuan
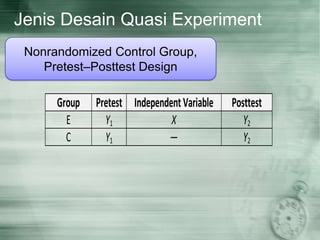
- 6. Jenis Desain Quasi Experiment Nonrandomized Control Group, Pretest–Posttest Design Counterbalanced Design One-Group Time-Series Design Control Group Time-Series Design
- 7. Jenis Desain Quasi Experiment Nonrandomized Control Group, Pretest–Posttest Design Group Pretest Independent Variable Posttest E Y1 X Y2 C Y1 — Y2
- 8. Jenis Desain Quasi Experiment Nonrandomized Control Group, Pretest–Posttest Design Dengan perlakuan Tanpa perlakuan Pretest Posttest
- 9. Jenis Desain Quasi Experiment Nonrandomized Control Group, Pretest–Posttest Design Dengan perlakuan Tanpa perlakuan Posttest Pretest
- 10. Jenis Desain Quasi Experiment Counterbalanced Design Experimental Treatments Replication X1 X2 X3 X4 1 Group A B C D 2 Group B A D B 3 Group C D A C 4 Group D C B A
- 11. Jenis Desain Quasi Experiment One-Group Time-Series Design Y1 Y2 Y3 Y4 X Y5 Y6 Y7 Y8
- 12. Jenis Desain Quasi Experiment Control Group Time-Series Design Group Exp. Y1 Y2 Y3 Y4 X Y5 Y6 Y 7 Y8 Cont. Y1 Y2 Y3 Y4 - Y5 Y6 Y 7 Y8
- 13. Faktor Bias Mengukur Perubahan Ceiling effect Regression effect Simpangan pengukuran yang berulang
- 14. Terima kasih Pertanyaan / Komentar ?
Editor's Notes
- #2: Animated picture buttons grow and turn on path(Advanced)To reproduce the curved shape on this slide, do the following:On the Home tab, in the ∫›∫›fl£s group, click Layout, and then click Blank.On the Home tab, in the Drawing group, click Shapes, and then under Basic Shapes click Right Triangle (first row, fourth option from the left).On the slide, draw a triangle. Under Drawing Tools, on the Format tab, in the Size group, enter 7.5‚Äù into the Height box and enter 4.75‚Äù into the Width box.On the Home tab, in the Drawing group, click Arrange, point to Align, and then do the following:Click Align Middle. Click Align Left.On the slide, select the triangle. Under Drawing Tools, on the Format tab, in the Insert Shapes group, click Edit Shape, and then click Edit Points. Right-click the diagonal side of the triangle, and then click Curved Segment. Click the bottom right corner of the triangle and then move the curve adjustment handle to create a consistent curve.Also on the Format tab, in the Shape Styles group, click Shape Fill, and then under Theme Colors click White, Background 1 (first row, first option from the left).Also on the Format tab, in the Shape Styles group, click Shape Outline, and then click No Outline.To reproduce the background effects on this slide, do the following:On the Design tab, in the Background group, click Background Styles, and then click Format Background. In the Format Background dialog box, click Fill in the left pane, select Gradient fill in the Fill pane, and then do the following:In the Type list, select Linear.In the Angle box, enter 225.Under Gradient stops, click Add gradient stops or Remove gradient stops until two stops appear in the slider.Also under Gradient stops, customize the gradient stops as follows:Select the first stop in the slider, and then do the following: In the Position box, enter 0%.Click the button next to Color, and then under Theme Colors click White, Background 1 (first row, first option from the left).In the Transparency box, enter 0%. Select the first stop in the slider, and then do the following: In the Position box, enter 100%.Click the button next to Color, click More Colors, and then in the Colors dialog box, on the Custom tab, enter values for Red: 230, Green: 230, Blue: 230.To reproduce the picture and text effects on this slide, do the following:On the Insert tab, in the Images group, click Picture. In the Insert Picture dialog box, select a picture, and then click Insert.On the slide, select the picture. Under Picture Tools, on the Format tab, in the Size group, click the arrow under Crop, click Crop to Shape, and then under Basic Shapes click Oval (first option from the left).With the picture still selected, under PictureTools, on the Format tab, in the Size group, click the Size and Position dialog box launcher. In the Format Picture dialog box, resize or crop the image so that the height is set to 1.2‚Äù and the widthis set to 1.2‚Äù. To crop the picture, click Crop in the left pane, and in the right pane, under Crop position, enter values into the Height, Width, Left, and Top boxes. To resize the picture, click Size in the left pane, and in the right pane, under Size and rotate, enter values into the Height and Width boxes.Also in the Format Picture dialog box, click 3-D Format in the left pane, and then, in the 3-D Format pane, do the following:Under Bevel, click the button next to Top and click Circle (first row, first option from the left).Under Surface, click the button next to Material, and then under Standard click Metal (fourth option from the left). Click the button next to Lighting, and then under Neutral click Contrasting (second row, second option from the left). In the Angle box, enter 25¬∞.Also in the Format Picture dialog box, click Shadow in the left pane. In the Shadow pane, click the button next to Presets, under Outer click Offset Diagonal Bottom Left (first row, third option from the left), and then do the following:In the Transparency box, enter 77%.In the Size box, enter 100%.In the Blur box, enter 10 pt.In the Angle box, enter 141¬∞.In the Distance box, enter 10 pt.On the slide, drag the picture onto the curve, near the top. On the Insert tab, in the Text group, click Text Box. On the slide, drag to draw the text box.Enter text in the text box and select it. On the Home tab, in the Font group, do the following:In the Font list, select Corbel.In the Font Size box, enter 22.Click the arrow next to Font Color,and then under Theme Colors click White, Background 1, Darker 50% (sixth row, first option from the left).On the Home tab, in the Paragraph group, click Align Text Left to align the text left in the text box.On the slide, drag the text box to the right of the picture. To reproduce the animation effects on this slide, do the following:It will help to zoom out in order to view the area off the slide. On the View tab, in the Zoom group, click Zoom. In the Zoom dialog box, select 65%.On the Animations tab, in the AdvancedAnimation group, click AddAnimation, and then click More Entrance Effects. In the Add Entrance Effect dialog box, under Moderate, click Grow & Turn, and then click OK.On the Animations tab, in the Timing group, in the Start list, select WithPrevious.On the Animations tab, in the Timing group, in the Duration box, enter 1. On the Animations tab, in the AdvancedAnimation group, click AddAnimation, and then under Motion Paths click Arcs.On the Animations tab, in the Timing group, in the Start list, select WithPrevious.On the Animations tab, in the Timing group, in the Duration box, enter 1. On the Animations tab, in the Animation group, click EffectOptions, and then click Right.On the Animations tab, in the Animation group, click EffectOptions, and then click Reverse Path Direction.On the slide, select the arc effect path, and then drag the bottom sizing handle below the bottom of the slide. Drag the right side sizing handle to the left until the path curve approximately matches the curve of the modified triangle. Drag the green rotation handle to the left to rotate the arc path to match the curve of the modified triangle. Drag the arc path so that the red arrow is in the center of the picture. You may need to make further adjustments to the length, width, and angle of the arc path to match the curve of the modified triangle.On the slide, select the text box. On the Animations tab, in the AdvancedAnimation group, click AddAnimation, and then under Entrance click Fade.On the Animations tab, in the Timing group, in the Start list, select After Previous.On the Animations tab, in the Timing group, in the Duration box, enter 1. To reproduce the other animated pictures and text boxes on this slide, do the following:On the Animations tab, in the Advanced Animation group, click Animation Pane. On the slide, press and hold CTRL and then select the picture and the text box. On the Home tab, in the Clipboard group, click the arrow next to Copy, and then click Duplicate.On the slide, drag the duplicate picture and text onto the curve below the first group. On the slide, select the duplicate picture. Under Picture Tools, on the Format tab, in the Adjust group, click ChangePicture. In the Insert Picture dialog box, select a picture, and then click Insert. Under PictureTools, on the Format tab, in the Size group, click the Size and Position dialog box launcher. In the Format Picture dialog box, resize or crop the image so that the height is set to 1.2‚Äù and the widthis set to 1.2‚Äù. To crop the picture, click Crop in the left pane, and in the right pane, under Crop position, enter values into the Height, Width, Left, and Top boxes. To resize the picture, click Size in the left pane, and in the right pane, under Size and rotate, enter values into the Height and Width boxes.In the AnimationPane, click the Arc animation effect for the new picture. Drag the green rotation handle to the right to rotate the arc path to match the curve of the modified triangle. Drag the arc path so that the red arrow is in the center of the picture.Click in the duplicate text box and edit the text.Repeat steps 2-7 two more times to reproduce the third and fourth pictures and text boxes with animation effects.