


Rate of change and slope
- 1. Rate of Change and Slope
- 2. Rate of Change allows you to see the relationship between two quantities that are changing (like; number of text messages and amount of bill. Or number of baskets made and basketball score) Rate of change =
- 3. Finding Rate of Change Using a Table Step 1: Find the difference in the dependent variable for two pairs of data. Step 2: Find the difference in the independent variable for the same two pairs of data. Step 3: Write the change in dependent over the change in independent as a ratio in simplest form. *The ratio is the rate of change! $120 5 $105 4 $90 3 $75 2 $60 1 Rental Charge Number of Days
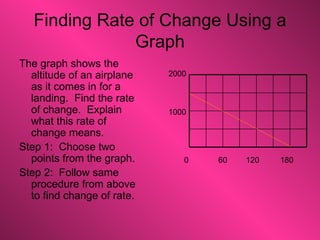
- 4. Finding Rate of Change Using a Graph The graph shows the altitude of an airplane as it comes in for a landing. Find the rate of change. Explain what this rate of change means. Step 1: Choose two points from the graph. Step 2: Follow same procedure from above to find change of rate. 2000 1000 0 60 120 180
- 5. 200 100 0 1 2 3 4 5 6 Time (hours)
- 6. Finding Slope Using Points Slope = EX: (5, 7) (-2, 1)
- 7. Find Slope: (2, 5) (4, 7) B. (-1, 4) (3, -2)
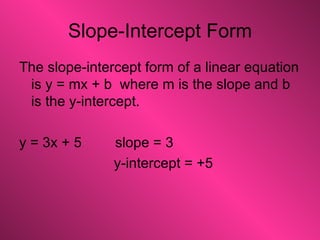
- 8. Slope-Intercept Form The slope-intercept form of a linear equation is y = mx + b where m is the slope and b is the y-intercept. y = 3x + 5 slope = 3 y-intercept = +5
- 9. y = -2x +1 y = ½ x – 3 y = 7x Write the equation: Slope = 5, y-intercept = -9 Slope = -4, y-intercept = 2 Slope = ¾, y-intercept = 0
- 10. Graphing An Equation Graph y = 3x + 1 Step 1: identify the y-intercept and graph that point (0, 1) Step 2: Use the slope (rise over run (3/1)) to graph several more points. Step 3: Connect the points to create the line.
- 11. Assignment: Pg. Odd numbers only.