Ratio analysi
Download as pptx, pdf2 likes657 views

This document is a report analyzing the financial ratios of Cello Plastic Products Ltd for the years 2010-11 and 2011-12. It contains 7 sections - an introduction to the company, objectives of the study, an overview of ratio analysis and classifications of ratios, research methodology, data analysis of key ratios including liquidity, leverage, activity and profitability ratios, suggestions and findings from the analysis, and conclusions. The data analysis section calculates various ratios for the two years and compares the trends, finding that liquidity is increasing while profitability ratios are decreasing from 2010-11 to 2011-12.
1 of 18
Downloaded 13 times


Ad
Recommended
Winner novel agglomeration process for ferroalloy fines
Winner novel agglomeration process for ferroalloy finesPRABHASH GOKARN
╠²
1) Tata Steel developed a novel agglomeration process to convert ferroalloy fines into briquettes that can be used directly in bulk steelmaking.
2) The process uses a resin binder and overcomes challenges related to the metallic nature of fines and establishing an economical agglomeration process.
3) Plant trials of the briquettes showed no operational issues and similar alloy pickup in steel compared to conventional lumps, leading to commercialization of the process.Company profile -benton 2015
Company profile -benton 2015ÕÅæ Õæ©
╠²
This company profile summarizes information about a manufacturing company established in 2010. It has a total factory area of 8,700 sq.m and 200 employees, including 20 in R&D. The company has 4 production lines with a monthly capacity of 150K tablets and 300K power banks. It has locations in Shenzhen and markets its portable PCs, tablets, power banks, smart watches and media players worldwide, particularly in the US, Europe, Asia and Middle East. Major customers and partners are not named.Company Portfolio version 1
Company Portfolio version 1William Yang
╠²
GZ Auspicious Chemical Co., Ltd is a fast growing manufacturer of specialty chemicals located in Guangzhou, China that provides products to cement plants. Founded in 2012, the company has extensive grinding expertise and knowledge of chemical and mineral interactions. GZ Chemical offers tailor-made cement grinding additives to help customers lower costs and increase production efficiency through benefits like reduced energy usage, increased strength, and contributions to sustainable development. As a leading chemical manufacturer, GZ Chemical combines business success with environmental protection and social responsibility.LUNCHBOX
LUNCHBOXilkim er
╠²
The document discusses the development of a lunch delivery service called Lunchbox Network. It begins by framing the problem of providing healthy homemade meals to busy city residents. Potential solutions like hiring food delivery are proposed. The project plan involves identifying users' needs, finding potential cooks, planning delivery logistics, and designing an interface. The team is introduced. Secondary research on existing meal services is presented. Challenges around food handling and trust are discussed. User interviews provide insights into time management, trust, lunch habits, and preferences for convenience and health. An app concept and prototype are created to connect cooks and eaters through a trusted platform.The lean explorers: SWOT, competition and segmentation. Session 5
The lean explorers: SWOT, competition and segmentation. Session 5Martine Ulvin
╠²
The document summarizes a business plan for the Heat Able Lunch Box, a heated lunch box that allows food to be heated on-the-go. It identifies competitors such as Tupperware and substitutes like eating at restaurants. A SWOT analysis finds strengths include solving a problem and being convenient, while weaknesses are price and uncertain demand. Opportunities exist in untapped markets and consumer trends, while threats include copying and cheaper alternatives. Market sizing identifies a total addressable market of 1 billion people globally and serviceable markets of 7.08 million in urban Portugal and 1.27 million in the initial target region of Lisbon.VP 08/2016 Tupperware EssencialTUPPERWARE ESSENCIAL
╠²
O documento resume iniciativas de sucesso da Nutrimetics em seu primeiro ano no Brasil, al├®m de fornecer dicas para uma Experi├¬ncia Tupperware sobre conserva├¦├Żo e reaproveitamento de alimentos. No primeiro ano, a Nutrimetics realizou 4 mil treinamentos em todo o Brasil e foi destaque na imprensa. A Experi├¬ncia Tupperware sugere uma receita que aproveita sobras e demonstra produtos para armazenamento e conserva├¦├Żo de alimentos.Greenbelt Hamilton Tower 2 E - Brochure
Greenbelt Hamilton Tower 2 E - Brochuredreamcityph
╠²
- The document describes a proposed residential development consisting of 176 units across 31 floors, with amenities shared between two towers. Unit types include studios and 1-2 bedroom units ranging in size from 41-87 square meters. Finishes and features are specified for different unit types. Amenities include pools, function rooms, and outdoor recreational areas. The development aims to provide modern living with secure access and building facilities.Hero mortcorp
Hero mortcorpDishant Nagrani
╠²
- The company's reserves and surpluses increased by 45.74% due to higher profits in 2012 compared to 2011. The company's working capital also increased substantially by 72.23%.
- While secured and unsecured loans decreased, investments also decreased substantially to repay some of the loans. Liquid assets like cash and debtors increased significantly.
- Inventory levels increased possibly due to lower demand, but the company's inventory turnover ratio remains high, indicating efficient inventory management.
- Key financial ratios like debt-equity, earnings per share and price-earnings all improved in 2012 compared to previous years, signaling stronger financial performance.Analysis of Tata Steel
Analysis of Tata SteelBhavin Agrawal
╠²
Tata Steel is India's largest steel company, established in 1907. It has manufacturing operations in 26 countries and was the 12th largest global steel producer in 2012. The document analyzes Tata Steel's financial performance from 2012-2014 through ratios like current ratio, debt-equity ratio, and profit margins. While Tata Steel saw asset growth over this period, it also experienced rising current liabilities, decreasing profits, and higher costs limiting net profit gains from sales increases in 2014.Management of working capital in national aluminium company 3 (1)
Management of working capital in national aluminium company 3 (1)prj_publication
╠²
This document analyzes working capital management in the National Aluminium Company (NALCO) over a 15-year period from 1995-1996 to 2009-2010. It aims to evaluate NALCO's management of cash, receivables, inventory, and the impact of working capital management on profitability. The author hypothesizes that cash balances affect operating expenses, provisioning for doubtful debts impacts receivables, inventory levels influence sales, and working capital management impacts profits. Statistical analysis is conducted to test these hypotheses using NALCO's annual reports and secondary data sources.FINACIAL ANALYSIS OF INDUS MOTORS
FINACIAL ANALYSIS OF INDUS MOTORSWaris Khan
╠²
This document analyzes the financial performance of a company over 5 years from 2009-2013 using various ratios and analyses. It summarizes key financial metrics like net income, sales, assets, and liabilities. Trend analyses show sales, costs, profits, and other figures generally increased year over year, with some fluctuations. The document provides a comprehensive review of the company's financial standing and growth over this period.Resume - Pawat Suwantanut
Resume - Pawat SuwantanutPawat Suwantanut
╠²
This document provides a summary of Pawat Suwantanut's work experience and qualifications. It details that he currently works as an EH&S delivery specialist for Siam Synthetic Latex Co., Ltd, implementing EH&S policies and representing Dow Chemical for audits. Previously he worked as a production engineer from 2008-2015, managing day-to-day operations and implementing various process improvement projects. He holds a Bachelor's degree in Chemical Engineering and has received extensive training in areas such as root cause investigation, social skills, and time management.fundamental analysis and valuation of public sector power companies
fundamental analysis and valuation of public sector power companiesNitin Jaggi
╠²
This document provides an overview and valuation of two major Indian public sector power companies: NTPC and NHPC. It first discusses Trustline Securities Ltd, the company conducting the analysis. It then provides background on India's power sector and an overview of NTPC, including its financials and valuation using DCF. For NHPC, it discusses the company overview and indicators but does not provide a valuation. The document aims to analyze and value these two major power companies in India.Conference call 1Q14
Conference call 1Q14Eternit S.A.
╠²
The document is the earnings report for Eternit Group for the first quarter of 2014. It summarizes the company's financial and operational performance compared to the same period in 2013. Some key points:
- Sales volumes grew for chrysotile mineral (24.4%), fiber cement (6.2%), and concrete tiles (5.4%).
- Consolidated net revenue increased 15.3% to R$243.7 million.
- EBITDA grew 9.1% to R$42.4 million.
- Net income increased 9.4% to R$23.5 million.
- Investments amounted to R$29.2 million, rising 64.3%3 q12 results presentation
3 q12 results presentationMagnesitaRI
╠²
Magnesita held an earnings call to discuss its 3Q12 results. Key highlights included revenues increasing 8.3% year-over-year but decreasing 4.6% quarter-over-quarter. EBITDA decreased year-over-year and quarter-over-quarter due to lower margins. The company also outlined a new strategic vision to become the best provider of refractories and industrial minerals by expanding its industrial minerals base, ensuring leadership in core markets, maintaining a global low-cost production base, and selectively growing in new markets.Magnesita 3 q12_presentation_en
Magnesita 3 q12_presentation_enMagnesita_ri
╠²
Magnesita held an earnings call to discuss its 3Q12 results. Key highlights included revenues increasing 8.3% year-over-year but decreasing 4.6% quarter-over-quarter. EBITDA decreased year-over-year and quarter-over-quarter due to lower margins. The company also outlined a new strategic vision to become the best provider of refractories and industrial minerals by expanding its industrial minerals base, ensuring leadership in core markets, maintaining a global low-cost production base, and selectively growing in new markets.Capital Budgeting process
Capital Budgeting processFacebook
╠²
The document discusses a capital budgeting proposal for expanding a cement industry in Pakistan. It begins by outlining the project steps, including investment screening, capital budget proposal, tracking, and auditing. It then analyzes opportunities and threats in the cement industry, including factors like existing cartels and resource availability. Porter's Five Forces model is applied to the industry. Selection criteria are listed and the capital budget methodology is outlined. Cost analyses are presented for the cement sector from 2008-2013, showing trends in sales price, costs, margins, and capacity. Finally, a proposal is made to incorporate a new company, obtain necessary registrations and approvals, and present the capital budget to the CEO for approval.Financial presentation of ssi groupŌĆØ
Financial presentation of ssi groupŌĆØPra Bzmae C Rai
╠²
Sahaviriya Steel Industries is Thailand's largest producer of high-quality steel sheets, established in 1990 with a vision to be the leading steel producer in Southeast Asia. It has achieved success in domestic market share and recognition through quality certifications and awards. The document analyzes SSI's business strategies, products, markets, competitors, financial performance ratios and outlook to evaluate its position and opportunities for continued growth.2011 deep research report on china tco glass industry
2011 deep research report on china tco glass industrysmarter2011
╠²
This document provides a summary of a 126-page research report on China's TCO glass industry in 2011. It examines the industry including defining TCO glass, describing manufacturing processes, analyzing major companies, and forecasting market supply and demand. The report finds that China's TCO glass production has grown rapidly to meet the needs of its expanding thin-film solar cell industry but domestic production has not fully satisfied demand. It provides detailed profiles of 18 key Chinese and global TCO glass manufacturers.bharat heavy electrical limited
bharat heavy electrical limitedAkash Gupta
╠²
The document provides information on Bharat Heavy Electricals Limited (BHEL), including its shareholding structure, financial performance, industry overview, and comparison to peers. Some key points:
- BHEL is one of India's largest engineering and manufacturing companies with over 10,000 MW of power projects commissioned.
- Its top shareholders are promoters (63.06%) followed by mutual funds (2.25%) and FI/Banks (5.26%).
- Between 2011-2016, BHEL's turnover grew from Rs. 30,947 crore to Rs. 50,156 crore though margins declined.
- The capital goods industry in India is expected to reach $125.4 billion by FYESG Performance Korea 2009
ESG Performance Korea 2009SolAbility
╠²
SolAbility conducted an ESG analysis of Korean companies from 2007-2009. They found that the 50 most sustainable companies significantly outperformed the market, returning 397% compared to 128% for the index. Average sustainability scores improved across economic, environmental and social criteria as management systems advanced. However, performance remained lower for environmental issues compared to economic and social factors. Electronic companies showed higher sustainability than sectors catering primarily to domestic markets.China tco glass industry
China tco glass industryReportsnReports
╠²
The 2010 deep research report on the China TCO glass industry provides an in-depth analysis of the global and Chinese markets, including TCO glass definitions, classifications, manufacturing technologies, and key manufacturers. It presents statistical data on production, capacity, demand, and pricing from 2008 to 2014, as well as feasibility analyses for various TCO glass projects. The report culminates with conclusions and development trend analyses, drawing on support from industry experts and enterprises.PETGAS ŌĆō Fundamental Analysis FY14
PETGAS ŌĆō Fundamental Analysis FY14lcchong76
╠²
The document provides a fundamental analysis of Petronas Gas Berhad (PetGas) for the financial year 2014, detailing its business operations in gas processing, transportation, and utilities, while highlighting its significant economic moats such as cost advantages and monopolistic positioning. It outlines the company's financial performance, including profit margins, revenue trends, and growth drivers, such as infrastructure projects and capital expenditure plans, while also acknowledging risks related to the petrochemical business and upstream supply challenges. The author expresses a positive outlook on PetGas shares, citing resilience in stock performance amidst global market fluctuations and the potential for future growth.Hp3513261332
Hp3513261332IJERA Editor
╠²
The study evaluates the working capital management of the flat glass industry in India, focusing on financial metrics such as current ratio and inventory turnover across nine major companies from 2006 to 2011. It concludes that while the overall working capital performance is satisfactory, the financial soundness varies significantly among the selected companies. Limitations include reliance on secondary data and the short study period, which may not provide a comprehensive view of industry dynamics.Global and china low e glass industry report, 2010-2011
Global and china low e glass industry report, 2010-2011ResearchInChina
╠²
This document analyzes the global and Chinese low-e glass industries. It focuses on China's low-e glass production and demand, and analyzes key companies in China and worldwide. Low-e glass production is concentrated in companies like CSG, Xinyi Glass, and Yaohua Pilkington, which mainly use offline technology. China's low-e glass output has increased annually in recent years, with about 20 new production lines planned through 2013. The report studies major international companies and 12 Chinese companies in the low-e glass industry.Sip
SipImran Vhora
╠²
This document presents a study on the capital structure and leverage analysis of Swiss Glascoat Equipments Limited. It analyzes the company's capital structure using the net income and net operating income approaches over the last 5 years. The degree of operating leverage has decreased by 0.20% while the degree of financial leverage has increased by 0.11%. Overall, the analysis finds that the company's current capital structure and profits are lower than the previous year, suggesting room for improvement.ESG & Sustainable Investment Performance
ESG & Sustainable Investment Performance SolAbility
╠²
The Korea ESG Performance 2010 report indicates that Korea's 50 most sustainable companies outperformed the KOSPI index significantly, demonstrating both short- and long-term financial advantages of sustainable investment. Despite the advancements since the government's 'green growth' initiative, many companies have yet to fully integrate sustainability into their management strategies, and the overall sustainability level of Korean companies still lags behind OECD averages. The report emphasizes the potential for long-term competitiveness if trends in sustainability management continue to improve.Financial analysis 2007 2012(cement companies.)
Financial analysis 2007 2012(cement companies.)Md. Shumon Iftikher
╠²
The document provides a financial analysis of three cement companies in Bangladesh: Confidence Cement Ltd., Hidelberg Cement Bangladesh Ltd., and Meghna Cement Mills Ltd. It includes analysis of the companies' income statements, balance sheets, liquidity, profitability, and leverage over time periods from 2007-2012. Key metrics like current ratio, return on assets, earnings per share, and price-earnings ratio are calculated and compared across the three companies.Smarter Aviation Data Management: Lessons from Swedavia Airports and Sweco
Smarter Aviation Data Management: Lessons from Swedavia Airports and SwecoSafe Software
╠²
Managing airport and airspace data is no small task, especially when youŌĆÖre expected to deliver it in AIXM format without spending a fortune on specialized tools. But what if there was a smarter, more affordable way?
Join us for a behind-the-scenes look at how Sweco partnered with Swedavia, the Swedish airport operator, to solve this challenge using FME and Esri.
Learn how they built automated workflows to manage periodic updates, merge airspace data, and support data extracts ŌĆō all while meeting strict government reporting requirements to the Civil Aviation Administration of Sweden.
Even better? Swedavia built custom services and applications that use the FME Flow REST API to trigger jobs and retrieve results ŌĆō streamlining tasks like securing the quality of new surveyor data, creating permdelta and baseline representations in the AIS schema, and generating AIXM extracts from their AIS data.
To conclude, FME expert Dean Hintz will walk through a GeoBorders reading workflow and highlight recent enhancements to FMEŌĆÖs AIXM (Aeronautical Information Exchange Model) processing and interpretation capabilities.
Discover how airports like Swedavia are harnessing the power of FME to simplify aviation data management, and how you can too.You are not excused! How to avoid security blind spots on the way to production
You are not excused! How to avoid security blind spots on the way to productionMichele Leroux Bustamante
╠²
We live in an ever evolving landscape for cyber threats creating security risk for your production systems. Mitigating these risks requires participation throughout all stages from development through production delivery - and by every role including architects, developers QA and DevOps engineers, product owners and leadership. No one is excused! This session will cover examples of common mistakes or missed opportunities that can lead to vulnerabilities in production - and ways to do better throughout the development lifecycle.More Related Content
Similar to Ratio analysi (20)
Analysis of Tata Steel
Analysis of Tata SteelBhavin Agrawal
╠²
Tata Steel is India's largest steel company, established in 1907. It has manufacturing operations in 26 countries and was the 12th largest global steel producer in 2012. The document analyzes Tata Steel's financial performance from 2012-2014 through ratios like current ratio, debt-equity ratio, and profit margins. While Tata Steel saw asset growth over this period, it also experienced rising current liabilities, decreasing profits, and higher costs limiting net profit gains from sales increases in 2014.Management of working capital in national aluminium company 3 (1)
Management of working capital in national aluminium company 3 (1)prj_publication
╠²
This document analyzes working capital management in the National Aluminium Company (NALCO) over a 15-year period from 1995-1996 to 2009-2010. It aims to evaluate NALCO's management of cash, receivables, inventory, and the impact of working capital management on profitability. The author hypothesizes that cash balances affect operating expenses, provisioning for doubtful debts impacts receivables, inventory levels influence sales, and working capital management impacts profits. Statistical analysis is conducted to test these hypotheses using NALCO's annual reports and secondary data sources.FINACIAL ANALYSIS OF INDUS MOTORS
FINACIAL ANALYSIS OF INDUS MOTORSWaris Khan
╠²
This document analyzes the financial performance of a company over 5 years from 2009-2013 using various ratios and analyses. It summarizes key financial metrics like net income, sales, assets, and liabilities. Trend analyses show sales, costs, profits, and other figures generally increased year over year, with some fluctuations. The document provides a comprehensive review of the company's financial standing and growth over this period.Resume - Pawat Suwantanut
Resume - Pawat SuwantanutPawat Suwantanut
╠²
This document provides a summary of Pawat Suwantanut's work experience and qualifications. It details that he currently works as an EH&S delivery specialist for Siam Synthetic Latex Co., Ltd, implementing EH&S policies and representing Dow Chemical for audits. Previously he worked as a production engineer from 2008-2015, managing day-to-day operations and implementing various process improvement projects. He holds a Bachelor's degree in Chemical Engineering and has received extensive training in areas such as root cause investigation, social skills, and time management.fundamental analysis and valuation of public sector power companies
fundamental analysis and valuation of public sector power companiesNitin Jaggi
╠²
This document provides an overview and valuation of two major Indian public sector power companies: NTPC and NHPC. It first discusses Trustline Securities Ltd, the company conducting the analysis. It then provides background on India's power sector and an overview of NTPC, including its financials and valuation using DCF. For NHPC, it discusses the company overview and indicators but does not provide a valuation. The document aims to analyze and value these two major power companies in India.Conference call 1Q14
Conference call 1Q14Eternit S.A.
╠²
The document is the earnings report for Eternit Group for the first quarter of 2014. It summarizes the company's financial and operational performance compared to the same period in 2013. Some key points:
- Sales volumes grew for chrysotile mineral (24.4%), fiber cement (6.2%), and concrete tiles (5.4%).
- Consolidated net revenue increased 15.3% to R$243.7 million.
- EBITDA grew 9.1% to R$42.4 million.
- Net income increased 9.4% to R$23.5 million.
- Investments amounted to R$29.2 million, rising 64.3%3 q12 results presentation
3 q12 results presentationMagnesitaRI
╠²
Magnesita held an earnings call to discuss its 3Q12 results. Key highlights included revenues increasing 8.3% year-over-year but decreasing 4.6% quarter-over-quarter. EBITDA decreased year-over-year and quarter-over-quarter due to lower margins. The company also outlined a new strategic vision to become the best provider of refractories and industrial minerals by expanding its industrial minerals base, ensuring leadership in core markets, maintaining a global low-cost production base, and selectively growing in new markets.Magnesita 3 q12_presentation_en
Magnesita 3 q12_presentation_enMagnesita_ri
╠²
Magnesita held an earnings call to discuss its 3Q12 results. Key highlights included revenues increasing 8.3% year-over-year but decreasing 4.6% quarter-over-quarter. EBITDA decreased year-over-year and quarter-over-quarter due to lower margins. The company also outlined a new strategic vision to become the best provider of refractories and industrial minerals by expanding its industrial minerals base, ensuring leadership in core markets, maintaining a global low-cost production base, and selectively growing in new markets.Capital Budgeting process
Capital Budgeting processFacebook
╠²
The document discusses a capital budgeting proposal for expanding a cement industry in Pakistan. It begins by outlining the project steps, including investment screening, capital budget proposal, tracking, and auditing. It then analyzes opportunities and threats in the cement industry, including factors like existing cartels and resource availability. Porter's Five Forces model is applied to the industry. Selection criteria are listed and the capital budget methodology is outlined. Cost analyses are presented for the cement sector from 2008-2013, showing trends in sales price, costs, margins, and capacity. Finally, a proposal is made to incorporate a new company, obtain necessary registrations and approvals, and present the capital budget to the CEO for approval.Financial presentation of ssi groupŌĆØ
Financial presentation of ssi groupŌĆØPra Bzmae C Rai
╠²
Sahaviriya Steel Industries is Thailand's largest producer of high-quality steel sheets, established in 1990 with a vision to be the leading steel producer in Southeast Asia. It has achieved success in domestic market share and recognition through quality certifications and awards. The document analyzes SSI's business strategies, products, markets, competitors, financial performance ratios and outlook to evaluate its position and opportunities for continued growth.2011 deep research report on china tco glass industry
2011 deep research report on china tco glass industrysmarter2011
╠²
This document provides a summary of a 126-page research report on China's TCO glass industry in 2011. It examines the industry including defining TCO glass, describing manufacturing processes, analyzing major companies, and forecasting market supply and demand. The report finds that China's TCO glass production has grown rapidly to meet the needs of its expanding thin-film solar cell industry but domestic production has not fully satisfied demand. It provides detailed profiles of 18 key Chinese and global TCO glass manufacturers.bharat heavy electrical limited
bharat heavy electrical limitedAkash Gupta
╠²
The document provides information on Bharat Heavy Electricals Limited (BHEL), including its shareholding structure, financial performance, industry overview, and comparison to peers. Some key points:
- BHEL is one of India's largest engineering and manufacturing companies with over 10,000 MW of power projects commissioned.
- Its top shareholders are promoters (63.06%) followed by mutual funds (2.25%) and FI/Banks (5.26%).
- Between 2011-2016, BHEL's turnover grew from Rs. 30,947 crore to Rs. 50,156 crore though margins declined.
- The capital goods industry in India is expected to reach $125.4 billion by FYESG Performance Korea 2009
ESG Performance Korea 2009SolAbility
╠²
SolAbility conducted an ESG analysis of Korean companies from 2007-2009. They found that the 50 most sustainable companies significantly outperformed the market, returning 397% compared to 128% for the index. Average sustainability scores improved across economic, environmental and social criteria as management systems advanced. However, performance remained lower for environmental issues compared to economic and social factors. Electronic companies showed higher sustainability than sectors catering primarily to domestic markets.China tco glass industry
China tco glass industryReportsnReports
╠²
The 2010 deep research report on the China TCO glass industry provides an in-depth analysis of the global and Chinese markets, including TCO glass definitions, classifications, manufacturing technologies, and key manufacturers. It presents statistical data on production, capacity, demand, and pricing from 2008 to 2014, as well as feasibility analyses for various TCO glass projects. The report culminates with conclusions and development trend analyses, drawing on support from industry experts and enterprises.PETGAS ŌĆō Fundamental Analysis FY14
PETGAS ŌĆō Fundamental Analysis FY14lcchong76
╠²
The document provides a fundamental analysis of Petronas Gas Berhad (PetGas) for the financial year 2014, detailing its business operations in gas processing, transportation, and utilities, while highlighting its significant economic moats such as cost advantages and monopolistic positioning. It outlines the company's financial performance, including profit margins, revenue trends, and growth drivers, such as infrastructure projects and capital expenditure plans, while also acknowledging risks related to the petrochemical business and upstream supply challenges. The author expresses a positive outlook on PetGas shares, citing resilience in stock performance amidst global market fluctuations and the potential for future growth.Hp3513261332
Hp3513261332IJERA Editor
╠²
The study evaluates the working capital management of the flat glass industry in India, focusing on financial metrics such as current ratio and inventory turnover across nine major companies from 2006 to 2011. It concludes that while the overall working capital performance is satisfactory, the financial soundness varies significantly among the selected companies. Limitations include reliance on secondary data and the short study period, which may not provide a comprehensive view of industry dynamics.Global and china low e glass industry report, 2010-2011
Global and china low e glass industry report, 2010-2011ResearchInChina
╠²
This document analyzes the global and Chinese low-e glass industries. It focuses on China's low-e glass production and demand, and analyzes key companies in China and worldwide. Low-e glass production is concentrated in companies like CSG, Xinyi Glass, and Yaohua Pilkington, which mainly use offline technology. China's low-e glass output has increased annually in recent years, with about 20 new production lines planned through 2013. The report studies major international companies and 12 Chinese companies in the low-e glass industry.Sip
SipImran Vhora
╠²
This document presents a study on the capital structure and leverage analysis of Swiss Glascoat Equipments Limited. It analyzes the company's capital structure using the net income and net operating income approaches over the last 5 years. The degree of operating leverage has decreased by 0.20% while the degree of financial leverage has increased by 0.11%. Overall, the analysis finds that the company's current capital structure and profits are lower than the previous year, suggesting room for improvement.ESG & Sustainable Investment Performance
ESG & Sustainable Investment Performance SolAbility
╠²
The Korea ESG Performance 2010 report indicates that Korea's 50 most sustainable companies outperformed the KOSPI index significantly, demonstrating both short- and long-term financial advantages of sustainable investment. Despite the advancements since the government's 'green growth' initiative, many companies have yet to fully integrate sustainability into their management strategies, and the overall sustainability level of Korean companies still lags behind OECD averages. The report emphasizes the potential for long-term competitiveness if trends in sustainability management continue to improve.Financial analysis 2007 2012(cement companies.)
Financial analysis 2007 2012(cement companies.)Md. Shumon Iftikher
╠²
The document provides a financial analysis of three cement companies in Bangladesh: Confidence Cement Ltd., Hidelberg Cement Bangladesh Ltd., and Meghna Cement Mills Ltd. It includes analysis of the companies' income statements, balance sheets, liquidity, profitability, and leverage over time periods from 2007-2012. Key metrics like current ratio, return on assets, earnings per share, and price-earnings ratio are calculated and compared across the three companies.Recently uploaded (20)
Smarter Aviation Data Management: Lessons from Swedavia Airports and Sweco
Smarter Aviation Data Management: Lessons from Swedavia Airports and SwecoSafe Software
╠²
Managing airport and airspace data is no small task, especially when youŌĆÖre expected to deliver it in AIXM format without spending a fortune on specialized tools. But what if there was a smarter, more affordable way?
Join us for a behind-the-scenes look at how Sweco partnered with Swedavia, the Swedish airport operator, to solve this challenge using FME and Esri.
Learn how they built automated workflows to manage periodic updates, merge airspace data, and support data extracts ŌĆō all while meeting strict government reporting requirements to the Civil Aviation Administration of Sweden.
Even better? Swedavia built custom services and applications that use the FME Flow REST API to trigger jobs and retrieve results ŌĆō streamlining tasks like securing the quality of new surveyor data, creating permdelta and baseline representations in the AIS schema, and generating AIXM extracts from their AIS data.
To conclude, FME expert Dean Hintz will walk through a GeoBorders reading workflow and highlight recent enhancements to FMEŌĆÖs AIXM (Aeronautical Information Exchange Model) processing and interpretation capabilities.
Discover how airports like Swedavia are harnessing the power of FME to simplify aviation data management, and how you can too.You are not excused! How to avoid security blind spots on the way to production
You are not excused! How to avoid security blind spots on the way to productionMichele Leroux Bustamante
╠²
We live in an ever evolving landscape for cyber threats creating security risk for your production systems. Mitigating these risks requires participation throughout all stages from development through production delivery - and by every role including architects, developers QA and DevOps engineers, product owners and leadership. No one is excused! This session will cover examples of common mistakes or missed opportunities that can lead to vulnerabilities in production - and ways to do better throughout the development lifecycle.Connecting Data and Intelligence: The Role of FME in Machine Learning
Connecting Data and Intelligence: The Role of FME in Machine LearningSafe Software
╠²
In this presentation, we want to explore powerful data integration and preparation for Machine Learning. FME is known for its ability to manipulate and transform geospatial data, connecting diverse data sources into efficient and automated workflows. By integrating FME with Machine Learning techniques, it is possible to transform raw data into valuable insights faster and more accurately, enabling intelligent analysis and data-driven decision making.Security Tips for Enterprise Azure Solutions
Security Tips for Enterprise Azure SolutionsMichele Leroux Bustamante
╠²
Delivering solutions to Azure may involve a variety of architecture patterns involving your applications, APIs data and associated Azure resources that comprise the solution. This session will use reference architectures to illustrate the security considerations to protect your Azure resources and data, how to achieve Zero Trust, and why it matters. Topics covered will include specific security recommendations for types Azure resources and related network security practices. The goal is to give you a breadth of understanding as to typical security requirements to meet compliance and security controls in an enterprise solution.Tech-ASan: Two-stage check for Address Sanitizer - Yixuan Cao.pdf
Tech-ASan: Two-stage check for Address Sanitizer - Yixuan Cao.pdfcaoyixuan2019
╠²
A presentation at Internetware 2025.Improving Data Integrity: Synchronization between EAM and ArcGIS Utility Netw...
Improving Data Integrity: Synchronization between EAM and ArcGIS Utility Netw...Safe Software
╠²
Utilities and water companies play a key role in the creation of clean drinking water. The creation and maintenance of clean drinking water is becoming a critical problem due to pollution and pressure on the environment. A lot of data is necessary to create clean drinking water. For fieldworkers, two types of data are key: Asset data in an asset management system (EAM for example) and Geographic data in a GIS (ArcGIS Utility Network ). Keeping this type of data up to date and in sync is a challenge for many organizations, leading to duplicating data and creating a bulk of extra attributes and data to keep everything in sync. Using FME, it is possible to synchronize Enterprise Asset Management (EAM) data with the ArcGIS Utility Network in real time. Changes (creation, modification, deletion) in ArcGIS Pro are relayed to EAM via FME, and vice versa. This ensures continuous synchronization of both systems without daily bulk updates, minimizes risks, and seamlessly integrates with ArcGIS Utility Network services. This presentation focuses on the use of FME at a Dutch water company, to create a sync between the asset management and GIS.Oh, the Possibilities - Balancing Innovation and Risk with Generative AI.pdf
Oh, the Possibilities - Balancing Innovation and Risk with Generative AI.pdfPriyanka Aash
╠²
Oh, the Possibilities - Balancing Innovation and Risk with Generative AIŌĆ£Key Requirements to Successfully Implement Generative AI in Edge DevicesŌĆöOpt...
ŌĆ£Key Requirements to Successfully Implement Generative AI in Edge DevicesŌĆöOpt...Edge AI and Vision Alliance
╠²
For the full video of this presentation, please visit: https://www.edge-ai-vision.com/2025/06/key-requirements-to-successfully-implement-generative-ai-in-edge-devices-optimized-mapping-to-the-enhanced-npx6-neural-processing-unit-ip-a-presentation-from-synopsys/
Gordon Cooper, Principal Product Manager at Synopsys, presents the ŌĆ£Key Requirements to Successfully Implement Generative AI in Edge DevicesŌĆöOptimized Mapping to the Enhanced NPX6 Neural Processing Unit IPŌĆØ tutorial at the May 2025 Embedded Vision Summit.
In this talk, Cooper discusses emerging trends in generative AI for edge devices and the key role of transformer-based neural networks. He reviews the distinct attributes of transformers, their advantages over conventional convolutional neural networks and how they enable generative AI.
Cooper then covers key requirements that must be met for neural processing units (NPU) to support transformers and generative AI in edge device applications. He uses transformer-based generative AI examples to illustrate the efficient mapping of these workloads onto the enhanced Synopsys ARC NPX NPU IP family.FIDO Seminar: Authentication for a Billion Consumers - Amazon.pptx
FIDO Seminar: Authentication for a Billion Consumers - Amazon.pptxFIDO Alliance
╠²
FIDO Seminar: Authentication for a Billion Consumers - AmazonWar_And_Cyber_3_Years_Of_Struggle_And_Lessons_For_Global_Security.pdf
War_And_Cyber_3_Years_Of_Struggle_And_Lessons_For_Global_Security.pdfbiswajitbanerjee38
╠²
Russia is one of the most aggressive nations when it comes to state coordinated cyberattacksŌĆŖŌĆöŌĆŖand Ukraine has been at the center of their crosshairs for 3 years. This report, provided the State Service of Special Communications and Information Protection of Ukraine contains an incredible amount of cybersecurity insights, showcasing the coordinated aggressive cyberwarfare campaigns of Russia against Ukraine.
It brings to the forefront that understanding your adversary, especially an aggressive nation state, is important for cyber defense. Knowing their motivations, capabilities, and tactics becomes an advantage when allocating resources for maximum impact.
Intelligence shows Russia is on a cyber rampage, leveraging FSB, SVR, and GRU resources to professionally target UkraineŌĆÖs critical infrastructures, military, and international diplomacy support efforts.
The number of total incidents against Ukraine, originating from Russia, has steadily increased from 1350 in 2021 to 4315 in 2024, but the number of actual critical incidents has been managed down from a high of 1048 in 2022 to a mere 59 in 2024ŌĆŖŌĆöŌĆŖshowcasing how the rapid detection and response to cyberattacks has been impacted by UkraineŌĆÖs improved cyber resilience.
Even against a much larger adversary, Ukraine is showcasing outstanding cybersecurity, enabled by strong strategies and sound tactics. There are lessons to learn for any enterprise that could potentially be targeted by aggressive nation states.
Definitely worth the read!10 Key Challenges for AI within the EU Data Protection Framework.pdf
10 Key Challenges for AI within the EU Data Protection Framework.pdfPriyanka Aash
╠²
10 Key Challenges for AI within the EU Data Protection FrameworkThe Future of Technology: 2025-2125 by Saikat Basu.pdf
The Future of Technology: 2025-2125 by Saikat Basu.pdfSaikat Basu
╠²
A peek into the next 100 years of technology. From Generative AI to Global AI networks to Martian Colonisation to Interstellar exploration to Industrial Nanotechnology to Artificial Consciousness, this is a journey you don't want to miss. Which ones excite you the most? Which ones are you apprehensive about? Feel free to comment! Let the conversation begin!AI vs Human Writing: Can You Tell the Difference?
AI vs Human Writing: Can You Tell the Difference?Shashi Sathyanarayana, Ph.D
╠²
This slide illustrates a side-by-side comparison between human-written, AI-written, and ambiguous content. It highlights subtle cues that help readers assess authenticity, raising essential questions about the future of communication, trust, and thought leadership in the age of generative AI.Information Security Response Team Nepal_npCERT_Vice_President_Sudan_Jha.pdf
Information Security Response Team Nepal_npCERT_Vice_President_Sudan_Jha.pdfICT Frame Magazine Pvt. Ltd.
╠²
Artificial Intelligence (AI) is rapidly changing the face of cybersecurity across the globe. In Nepal, the shift is already underway. Vice President of the Information Security Response Team Nepal (npCERT) and Information Security Consultant at One Cover Pvt. Ltd., Sudan Jha, recently presented an in-depth workshop on how AI can strengthen national security and digital defenses."How to survive Black Friday: preparing e-commerce for a peak season", Yurii ...
"How to survive Black Friday: preparing e-commerce for a peak season", Yurii ...Fwdays
╠²
We will explore how e-commerce projects prepare for the busiest time of the year, which key aspects to focus on, and what to expect. WeŌĆÖll share our experience in setting up auto-scaling, load balancing, and discuss the loads that Silpo handles, as well as the solutions that help us navigate this season without failures.Coordinated Disclosure for ML - What's Different and What's the Same.pdf
Coordinated Disclosure for ML - What's Different and What's the Same.pdfPriyanka Aash
╠²
Coordinated Disclosure for ML - What's Different and What's the SamePowering Multi-Page Web Applications Using Flow Apps and FME Data Streaming
Powering Multi-Page Web Applications Using Flow Apps and FME Data StreamingSafe Software
╠²
Unleash the potential of FME Flow to build and deploy advanced multi-page web applications with ease. Discover how Flow Apps and FMEŌĆÖs data streaming capabilities empower you to create interactive web experiences directly within FME Platform. Without the need for dedicated web-hosting infrastructure, FME enhances both data accessibility and user experience. Join us to explore how to unlock the full potential of FME for your web projects and seamlessly integrate data-driven applications into your workflows.You are not excused! How to avoid security blind spots on the way to production
You are not excused! How to avoid security blind spots on the way to productionMichele Leroux Bustamante
╠²
ŌĆ£Key Requirements to Successfully Implement Generative AI in Edge DevicesŌĆöOpt...
ŌĆ£Key Requirements to Successfully Implement Generative AI in Edge DevicesŌĆöOpt...Edge AI and Vision Alliance
╠²
Information Security Response Team Nepal_npCERT_Vice_President_Sudan_Jha.pdf
Information Security Response Team Nepal_npCERT_Vice_President_Sudan_Jha.pdfICT Frame Magazine Pvt. Ltd.
╠²
Ad
Ratio analysi
- 1. AN APPLICATION OF RATIO ANALYSIS FOR CELLO PLASTIC PRODUCTS LTD Submitted in partial fulfillment of the requirement for the Degree of Master of Business Administration) Under the supervision of: Ms Neha Aggarwal Submitted by: Sonali Kukreja
- 2. CONTENTS S.NO. TITLE 1 CELLO ŌĆōAN INTRODUCTION 2 OBJECTIVES OF THE STUDY 3 RATIO ANALYSIS 4 RESEARCH METHODOLOGY 5 DATA ANALYSIS 6 SUGGESTIONS AND FINDINGS 7 CONCLUSIONS
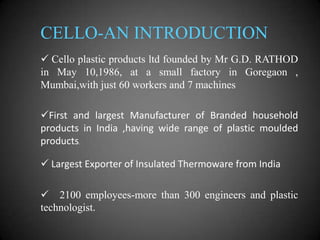
- 3. CELLO-AN INTRODUCTION ’ā╝ Cello plastic products ltd founded by Mr G.D. RATHOD in May 10,1986, at a small factory in Goregaon , Mumbai,with just 60 workers and 7 machines ’ā╝First and largest Manufacturer of Branded household products in India ,having wide range of plastic moulded products. ’ā╝ Largest Exporter of Insulated Thermoware from India ’ā╝ 2100 employees-more than 300 engineers and plastic technologist.
- 4. OBJECTIVES OF THE STUDY ’ü▒ To have an indepth knowledge of ratio analysis of the company ’ü▒ To make comparisons between the ratios during different periods(2years data from 2011 to 2012 )
- 5. RATIO ANALYSIS ’üČ Ratio analysis is a technique of analysis ,comparison and interpretation of financial statements. ’üČ According to AccountantŌĆÖs Handbook by Wixon, Kell and Bedford, ŌĆ£a ratio is an expression of the quantitative relationship between two numbersŌĆØ ’üČ It is helpful to know about the liquidity, solvency, capital structure and profitability of an organization.
- 6. CLASSIFICATION OF RATIO Types of ratios Liquidity ratio Leverage ratio Activity ratio Profitability ratio
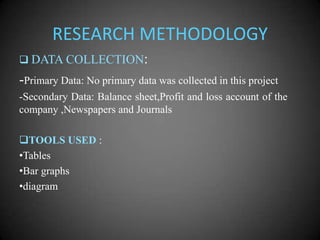
- 7. RESEARCH METHODOLOGY ’ü▒ DATA COLLECTION: -Primary Data: No primary data was collected in this project -Secondary Data: Balance sheet,Profit and loss account of the company ,Newspapers and Journals ’ü▒TOOLS USED : ŌĆóTables ŌĆóBar graphs ŌĆódiagram
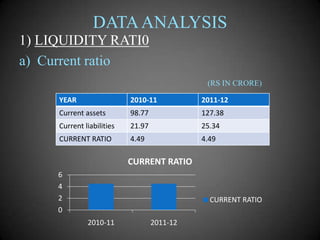
- 8. DATA ANALYSIS 1) LIQUIDITY RATI0 a) Current ratio (RS IN CRORE) YEAR 2010-11 2011-12 Current assets 98.77 127.38 Current liabilities 21.97 25.34 CURRENT RATIO 4.49 4.49 CURRENT RATIO 6 4 2 0 CURRENT RATIO 2010-11 2011-12
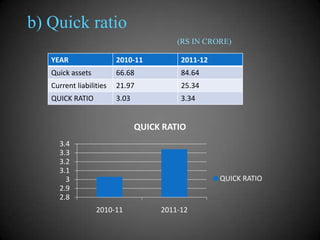
- 9. b) Quick ratio (RS IN CRORE) YEAR 2010-11 2011-12 Quick assets 66.68 84.64 Current liabilities 21.97 25.34 QUICK RATIO 3.03 3.34 QUICK RATIO 3.4 3.3 3.2 3.1 3 2.9 2.8 QUICK RATIO 2010-11 2011-12
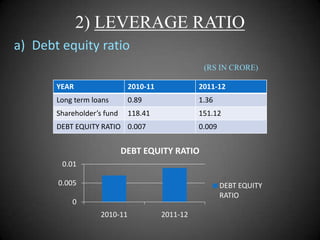
- 10. 2) LEVERAGE RATIO a) Debt equity ratio (RS IN CRORE) YEAR 2010-11 2011-12 Long term loans 0.89 1.36 ShareholderŌĆÖs fund 118.41 151.12 DEBT EQUITY RATIO 0.007 0.009 DEBT EQUITY RATIO 0.01 0.005 DEBT EQUITY RATIO 0 2010-11 2011-12
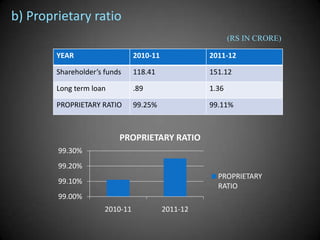
- 11. b) Proprietary ratio (RS IN CRORE) YEAR 2010-11 2011-12 ShareholderŌĆÖs funds 118.41 151.12 Long term loan .89 1.36 PROPRIETARY RATIO 99.25% 99.11% PROPRIETARY RATIO 99.30% 99.20% PROPRIETARY RATIO 99.10% 99.00% 2010-11 2011-12
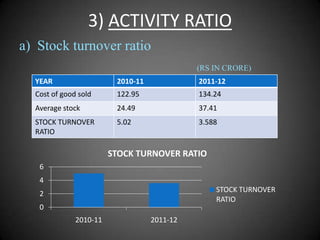
- 12. 3) ACTIVITY RATIO a) Stock turnover ratio (RS IN CRORE) YEAR 2010-11 2011-12 Cost of good sold 122.95 134.24 Average stock 24.49 37.41 STOCK TURNOVER RATIO 5.02 3.588 STOCK TURNOVER RATIO 6 4 STOCK TURNOVER RATIO 2 0 2010-11 2011-12
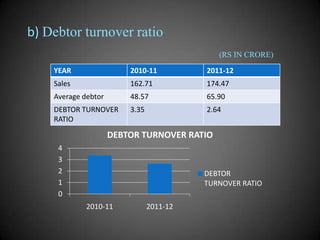
- 13. b) Debtor turnover ratio (RS IN CRORE) YEAR 2010-11 2011-12 Sales 162.71 174.47 Average debtor 48.57 65.90 DEBTOR TURNOVER RATIO 3.35 2.64 DEBTOR TURNOVER RATIO 4 3 2 1 0 DEBTOR TURNOVER RATIO 2010-11 2011-12
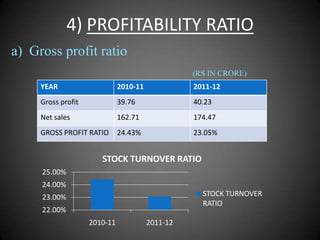
- 14. 4) PROFITABILITY RATIO a) Gross profit ratio (RS IN CRORE) YEAR 2010-11 2011-12 Gross profit 39.76 40.23 Net sales 162.71 174.47 GROSS PROFIT RATIO 24.43% 23.05% STOCK TURNOVER RATIO 25.00% 24.00% STOCK TURNOVER RATIO 23.00% 22.00% 2010-11 2011-12
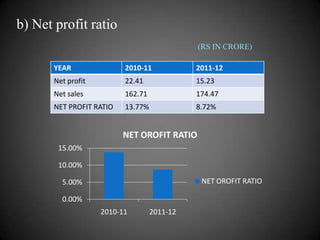
- 15. b) Net profit ratio (RS IN CRORE) YEAR 2010-11 2011-12 Net profit 22.41 15.23 Net sales 162.71 174.47 NET PROFIT RATIO 13.77% 8.72% NET OROFIT RATIO 15.00% 10.00% NET OROFIT RATIO 5.00% 0.00% 2010-11 2011-12
- 16. SUGGESTIONS AND FINDINGS SUGGESTIONS ’ā╝The profit ratio is decreased in current year so the company should pay attention to this because profit making is the prime objective of every business ’ā╝The company should make the balance between liquidity and solvency position of the company FINDINGS
- 17. CONCLUSIONS ’üČLiquidity ratio is increasing from the last year , fixed assets are also increasing compare to the previous year and equity share capital remain same in the current year. ’üČDebtors turnover ratio has decreased which shows that the company is not utilizing its debtorŌĆÖs efficiency and creditors turnover ratio has also reduced which indicates less period of credit enjoyed by the business. ’üČ Profitability ratio decreases which is not the good indicator for the company
- 18. THANK YOU