際際滷

際際滷Share a Scribd company logo
 Relative Growth Rate (RGR)
 Doubling Time (Dt)
 Collaborative Coefficient (CC)
 Activity Index (AI)
 Co-authorship Index(CAI)
 Author Productivity
 Degree of Collaboration
 Bradford Law of Scattering and
Lotkas Law
 Priority Index (RPI)
Contents
Relative Growth Rate (RGR)
The mean relative growth rate R-(1-2) over a specified period of interval can be calculated
from the following equation.
W2-W1
R(1-2) = -----------
T2-T1
Where,
R (1-2) = Mean relative growth rate over the specified period interval;
W1 = log w1 (Natural log of initial number of publications)
W2 = log w2 (Natural log of initial number of publications)
T2-T1 = the unit difference between the initial time and final time.
DOUBLING TIME
Doubling time (Dt) = 0.693/R(a)
Therefore,
Doubling time for publications Dt(a) = 0.693 / R (a)
The pattern of co-authorship among different countries have been examined by
making use of Collaborative Coefficient (CC) suggested by Ajiferuke e.tal (1988).
The formula used for calculating CC is as follows. Where
k
CC=1-[ (1/j)Fj/N]
J=1
Fj=the number of authored papers
N=total number of research published; and
k=the greatest number of authors per paper
COLLABORATIVE COEFFICIENT (CC)
According to Ajiferuke, CC tends to zero as single-authored papers dominate, and to 1-1/j as
j-authored papers dominate. This implies that higher the value of CC, higher the probability of
multi-authored papers.
COLLABORATIVE COEFFICIENT (CC)
To study how the patterns of co-authorship have changed during a period use of Co-
authorship index has been applied in this study. For calculating CAI the entire data set was
divided into four blocks.
CAI={(Nij/Nio)/(Noj/Noo)}*100
Nij : Number of papers having j authors in block I
Nio : Total Output of Block I
Noj : Number of papers having j authors for all blocks;
Noo : Total number of papers for all authors and all blocks
J=1, 2, 3, > 4
CO-AUTHORSHIP INDEX (CAI)
Activity Index characterises the relative research effort of a country toa given field. It is defined
as
AI =(given fields share in the countrys publication output) / (given fields share in the worlds
publication output) } x 100
AI =100 indicates that the countrys research effort in the given field
Corresponds precisely to the worlds average. AI>100 reflects higher activity than the worlds
average, and AI<100 indicates lower than average effort dedicated to the field under study.
In this study, Activity Index for India has been calculated for different years to see how Indias
research activity changed during different years using the above formula.
Activity Index characterizes the relative research effort of a country to a given field.
ACTIVITY INDEX (AI)
AI = {(Ii / Io ) / (W i / Wo )} x 100
Where
Ii=Indias output in the year i
Io=Total Indian output
wi=world output in the year i
wo=Total world output
ACTIVITY INDEX (AI)
In order to identify the degree of collaboration, the
research or has adopted K. Subramanyams
formula3.
The formula is C = Nm/(Nm+Ns)
Where,
C = Degree of collaboration in a discipline
Nm = Number of multiple authored papers
Ns = Number of the single authored papers
DEGREE OF COLLABORATION
Research priority Index is a statistical tool for applying cross-national comparisons. Priority index
(PI) is computed by the following formula
nij/nio
PI=________ x 100
noj/noo
Where as
nij = the number of publications of country i in sub-field j.
nio = the number of publications of country i in all sub-field
noj = the number of publications of all countries in sub-field j, and
noo = the number of publications of all countries in all sub-fields.
RESEARCH PRIORITY INDEX (RPI)
The sum was used as deviser for 1/n 4.65 to determine the proportion of the total number of
authors expected to produce n paper (in the case of present study n=1,2,3,4, 10), the following
formula was used to find the proportions.
S = 裡 1/n 4.65
For present study S is the sum of Lotkas modified rations for the value a= 4.65.
The formula
An = 1/n 4.65 T/S (n = 1,2,3, ..10)
Where T is total number of authors in the sampling and An is the total number of expected
authors producing n papers.
LOTKAS LAW OF AUTHORS PRODUCTIVITY
LOTKAS LAW OF AUTHORS PRODUCTIVITY 
The Lotkas law also tested with the application of scientific productivity chi-square model in
relation to a number of authors who contributed n number of publication.
It can be expressed by the equation an = a1/n2, n =1,2,3
The chi-square can be computed as (F-p) 2/p.
F = observed number of authors with n publications
P = expected number of authors.
TABLE7: SHOWING PRODUCTIVITY OF AUTHOR BASED ON LOTKAS LAW
No. of
authors
Observed
Number of
authors with n
or (an) or (f)
Observed
percentage of
authors 100 x an /
a1
Expected
number of
authors
(an=an/n2
)or(p)
(F-
P)^2/P
1 1131 100.00 1131.00 0.00
2 1395 123.34 348.75 3138.75
3 1183 104.60 131.44 8412.44
4 793 70.11 49.56 11151.56
5 491 43.41 19.64 11312.64
6 273 24.14 7.58 9289.58
7 130 11.49 2.65 6112.65
8 78 6.90 1.22 4837.22
9 46 4.07 0.57 3634.57
10+ 72 6.37 0.72 7056.72
Total 5592 1693.13 64946.14
Price's Square Root law, which states that half (50%) of the literature on a subject will
be contributed by the square root of total number of authors publishing in that area.
PRICES SQUARE ROOT LAW
Pareto Principle (80/20 Rule) states that, for many events, roughly 80% of
the effects come from 20% of the causes. The original observation was in
connection with income and wealth. Pareto noticed that 80% of Italy's wealth was
owned by 20% of the population. He then carried out surveys on a variety of
other countries and found to his surprise that a similar distribution applied.
PARETO PRINCIPLE (80/20 RULE) AND COLLABORATIVE INDEX
Bradfords law is to explain that a group of journals could be arranged in an order of
decreasing productivity and showed that journals which field most productive articles are
coming first and the most unproductively in the last. According to this journals are to be
grouped into a number of zones each producing a similar number of articles. However the
number of journals in each zone well be increasing rapidly. Then the relationship between
the zones is 1:n:n2 . According to Bradfords distribution, the relationship between the zone
is 1:n:n2 contrastingly the relationship in each of the present study.
BRADFORDS LAW OF SCATTERING JOURNALS
ZIPF's LAW OF WORD OCCURRENCE
RANKING OF WORD OCCURRENCE

More Related Content

Recently uploaded (20)

PDF
Indian National movement PPT by Simanchala Sarab, Covering The INC(Formation,...
Simanchala Sarab, BABed(ITEP Secondary stage) in History student at GNDU Amritsar
PPT
21st Century Literature from the Philippines and the World QUARTER 1/ MODULE ...
isaacmendoza76
PDF
Nanotechnology and Functional Foods Effective Delivery of Bioactive Ingredien...
rmswlwcxai8321
PPTX
How to Configure Refusal of Applicants in Odoo 18 Recruitment
Celine George
PDF
Andreas Schleicher_Teaching Compass_Education 2040.pdf
EduSkills OECD
PPTX
Lesson 1 Cell (Structures, Functions, and Theory).pptx
marvinnbustamante1
PDF
Gladiolous Cultivation practices by AKL.pdf
kushallamichhame
PDF
Quiz Night Live May 2025 - Intra Pragya Online General Quiz
Pragya - UEM Kolkata Quiz Club
PDF
Supply Chain Security A Comprehensive Approach 1st Edition Arthur G. Arway
rxgnika452
PDF
Wikinomics How Mass Collaboration Changes Everything Don Tapscott
wcsqyzf5909
PDF
CAD25 Gbadago and Fafa Presentation Revised-Aston Business School, UK.pdf
Kweku Zurek
DOCX
Lesson 1 - Nature and Inquiry of Research
marvinnbustamante1
PPTX
Comparing Translational and Rotational Motion.pptx
AngeliqueTolentinoDe
PDF
Lesson 1 - Nature of Inquiry and Research.pdf
marvinnbustamante1
PPTX
PLANNING FOR EMERGENCY AND DISASTER MANAGEMENT ppt.pptx
PRADEEP ABOTHU
PPTX
How to Add a Custom Button in Odoo 18 POS Screen
Celine George
PPTX
How Physics Enhances Our Quality of Life.pptx
AngeliqueTolentinoDe
PPTX
Elo the Hero is an story about a young boy who became hero.
TeacherEmily1
PPTX
How to Manage Wins & Losses in Odoo 18 CRM
Celine George
PDF
Lesson 1 : Science and the Art of Geography Ecosystem
marvinnbustamante1
Indian National movement PPT by Simanchala Sarab, Covering The INC(Formation,...
Simanchala Sarab, BABed(ITEP Secondary stage) in History student at GNDU Amritsar
21st Century Literature from the Philippines and the World QUARTER 1/ MODULE ...
isaacmendoza76
Nanotechnology and Functional Foods Effective Delivery of Bioactive Ingredien...
rmswlwcxai8321
How to Configure Refusal of Applicants in Odoo 18 Recruitment
Celine George
Andreas Schleicher_Teaching Compass_Education 2040.pdf
EduSkills OECD
Lesson 1 Cell (Structures, Functions, and Theory).pptx
marvinnbustamante1
Gladiolous Cultivation practices by AKL.pdf
kushallamichhame
Quiz Night Live May 2025 - Intra Pragya Online General Quiz
Pragya - UEM Kolkata Quiz Club
Supply Chain Security A Comprehensive Approach 1st Edition Arthur G. Arway
rxgnika452
Wikinomics How Mass Collaboration Changes Everything Don Tapscott
wcsqyzf5909
CAD25 Gbadago and Fafa Presentation Revised-Aston Business School, UK.pdf
Kweku Zurek
Lesson 1 - Nature and Inquiry of Research
marvinnbustamante1
Comparing Translational and Rotational Motion.pptx
AngeliqueTolentinoDe
Lesson 1 - Nature of Inquiry and Research.pdf
marvinnbustamante1
PLANNING FOR EMERGENCY AND DISASTER MANAGEMENT ppt.pptx
PRADEEP ABOTHU
How to Add a Custom Button in Odoo 18 POS Screen
Celine George
How Physics Enhances Our Quality of Life.pptx
AngeliqueTolentinoDe
Elo the Hero is an story about a young boy who became hero.
TeacherEmily1
How to Manage Wins & Losses in Odoo 18 CRM
Celine George
Lesson 1 : Science and the Art of Geography Ecosystem
marvinnbustamante1

Featured (20)

PDF
2024 Trend Updates: What Really Works In SEO & Content Marketing
Search Engine Journal
PDF
Storytelling For The Web: Integrate Storytelling in your Design Process
Chiara Aliotta
PDF
Artificial Intelligence, Data and Competition SCHREPEL June 2024 OECD dis...
OECD Directorate for Financial and Enterprise Affairs
PDF
How to Leverage AI to Boost Employee Wellness - Lydia Di Francesco - SocialHR...
SocialHRCamp
PDF
2024 State of Marketing Report by Hubspot
Marius Sescu
PDF
Everything You Need To Know About ChatGPT
Expeed Software
PDF
Product Design Trends in 2024 | Teenage Engineerings
Pixeldarts
PDF
How Race, Age and Gender Shape Attitudes Towards Mental Health
ThinkNow
PDF
AI Trends in Creative Operations 2024 by Artwork Flow.pdf
marketingartwork
PDF
Skeleton Culture Code
Skeleton Technologies
PDF
PEPSICO Presentation to CAGNY Conference Feb 2024
Neil Kimberley
PDF
Content Methodology: A Best Practices Report (Webinar)
contently
PPTX
How to Prepare For a Successful Job Search for 2024
Albert Qian
PDF
Social Media Marketing Trends 2024 // The Global Indie Insights
Kurio // The Social Media Age(ncy)
PDF
Trends In Paid Search: Navigating The Digital Landscape In 2024
Search Engine Journal
PDF
5 Public speaking tips from TED - Visualized summary
SpeakerHub
PDF
ChatGPT and the Future of Work - Clark Boyd
Clark Boyd
PDF
Getting into the tech field. what next
Tessa Mero
PDF
Google's Just Not That Into You: Understanding Core Updates & Search Intent
Lily Ray
PDF
How to have difficult conversations
Rajiv Jayarajah, MAppComm, ACC
2024 Trend Updates: What Really Works In SEO & Content Marketing
Search Engine Journal
Storytelling For The Web: Integrate Storytelling in your Design Process
Chiara Aliotta
Artificial Intelligence, Data and Competition SCHREPEL June 2024 OECD dis...
OECD Directorate for Financial and Enterprise Affairs
How to Leverage AI to Boost Employee Wellness - Lydia Di Francesco - SocialHR...
SocialHRCamp
2024 State of Marketing Report by Hubspot
Marius Sescu
Everything You Need To Know About ChatGPT
Expeed Software
Product Design Trends in 2024 | Teenage Engineerings
Pixeldarts
How Race, Age and Gender Shape Attitudes Towards Mental Health
ThinkNow
AI Trends in Creative Operations 2024 by Artwork Flow.pdf
marketingartwork
Skeleton Culture Code
Skeleton Technologies
PEPSICO Presentation to CAGNY Conference Feb 2024
Neil Kimberley
Content Methodology: A Best Practices Report (Webinar)
contently
How to Prepare For a Successful Job Search for 2024
Albert Qian
Social Media Marketing Trends 2024 // The Global Indie Insights
Kurio // The Social Media Age(ncy)
Trends In Paid Search: Navigating The Digital Landscape In 2024
Search Engine Journal
5 Public speaking tips from TED - Visualized summary
SpeakerHub
ChatGPT and the Future of Work - Clark Boyd
Clark Boyd
Getting into the tech field. what next
Tessa Mero
Google's Just Not That Into You: Understanding Core Updates & Search Intent
Lily Ray
How to have difficult conversations
Rajiv Jayarajah, MAppComm, ACC
Ad

Relative Growth Rate ppt.ppt

  • 1. Relative Growth Rate (RGR) Doubling Time (Dt) Collaborative Coefficient (CC) Activity Index (AI) Co-authorship Index(CAI) Author Productivity Degree of Collaboration Bradford Law of Scattering and Lotkas Law Priority Index (RPI) Contents
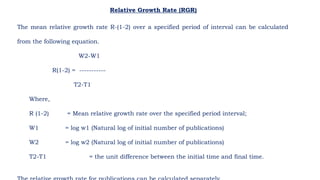
  • 2. Relative Growth Rate (RGR) The mean relative growth rate R-(1-2) over a specified period of interval can be calculated from the following equation. W2-W1 R(1-2) = ----------- T2-T1 Where, R (1-2) = Mean relative growth rate over the specified period interval; W1 = log w1 (Natural log of initial number of publications) W2 = log w2 (Natural log of initial number of publications) T2-T1 = the unit difference between the initial time and final time.
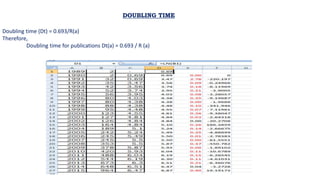
  • 3. DOUBLING TIME Doubling time (Dt) = 0.693/R(a) Therefore, Doubling time for publications Dt(a) = 0.693 / R (a)
  • 4. The pattern of co-authorship among different countries have been examined by making use of Collaborative Coefficient (CC) suggested by Ajiferuke e.tal (1988). The formula used for calculating CC is as follows. Where k CC=1-[ (1/j)Fj/N] J=1 Fj=the number of authored papers N=total number of research published; and k=the greatest number of authors per paper COLLABORATIVE COEFFICIENT (CC)
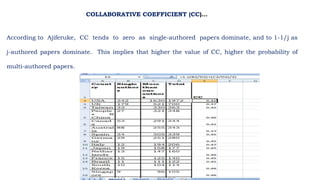
  • 5. According to Ajiferuke, CC tends to zero as single-authored papers dominate, and to 1-1/j as j-authored papers dominate. This implies that higher the value of CC, higher the probability of multi-authored papers. COLLABORATIVE COEFFICIENT (CC)
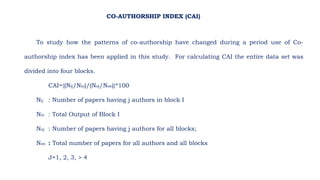
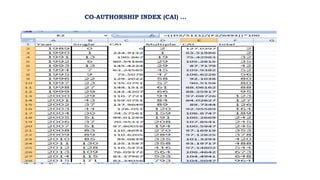
  • 6. To study how the patterns of co-authorship have changed during a period use of Co- authorship index has been applied in this study. For calculating CAI the entire data set was divided into four blocks. CAI={(Nij/Nio)/(Noj/Noo)}*100 Nij : Number of papers having j authors in block I Nio : Total Output of Block I Noj : Number of papers having j authors for all blocks; Noo : Total number of papers for all authors and all blocks J=1, 2, 3, > 4 CO-AUTHORSHIP INDEX (CAI)
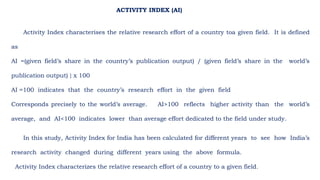
  • 8. Activity Index characterises the relative research effort of a country toa given field. It is defined as AI =(given fields share in the countrys publication output) / (given fields share in the worlds publication output) } x 100 AI =100 indicates that the countrys research effort in the given field Corresponds precisely to the worlds average. AI>100 reflects higher activity than the worlds average, and AI<100 indicates lower than average effort dedicated to the field under study. In this study, Activity Index for India has been calculated for different years to see how Indias research activity changed during different years using the above formula. Activity Index characterizes the relative research effort of a country to a given field. ACTIVITY INDEX (AI)
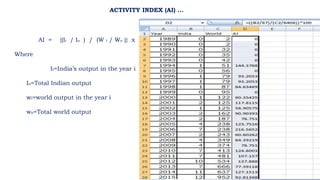
  • 9. AI = {(Ii / Io ) / (W i / Wo )} x 100 Where Ii=Indias output in the year i Io=Total Indian output wi=world output in the year i wo=Total world output ACTIVITY INDEX (AI)
  • 10. In order to identify the degree of collaboration, the research or has adopted K. Subramanyams formula3. The formula is C = Nm/(Nm+Ns) Where, C = Degree of collaboration in a discipline Nm = Number of multiple authored papers Ns = Number of the single authored papers DEGREE OF COLLABORATION
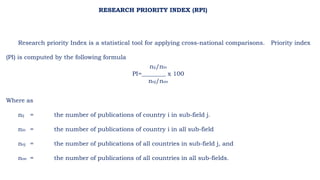
  • 11. Research priority Index is a statistical tool for applying cross-national comparisons. Priority index (PI) is computed by the following formula nij/nio PI=________ x 100 noj/noo Where as nij = the number of publications of country i in sub-field j. nio = the number of publications of country i in all sub-field noj = the number of publications of all countries in sub-field j, and noo = the number of publications of all countries in all sub-fields. RESEARCH PRIORITY INDEX (RPI)
  • 12. The sum was used as deviser for 1/n 4.65 to determine the proportion of the total number of authors expected to produce n paper (in the case of present study n=1,2,3,4, 10), the following formula was used to find the proportions. S = 裡 1/n 4.65 For present study S is the sum of Lotkas modified rations for the value a= 4.65. The formula An = 1/n 4.65 T/S (n = 1,2,3, ..10) Where T is total number of authors in the sampling and An is the total number of expected authors producing n papers. LOTKAS LAW OF AUTHORS PRODUCTIVITY
  • 13. LOTKAS LAW OF AUTHORS PRODUCTIVITY The Lotkas law also tested with the application of scientific productivity chi-square model in relation to a number of authors who contributed n number of publication. It can be expressed by the equation an = a1/n2, n =1,2,3 The chi-square can be computed as (F-p) 2/p. F = observed number of authors with n publications P = expected number of authors.
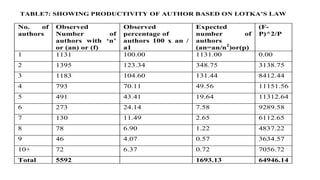
  • 14. TABLE7: SHOWING PRODUCTIVITY OF AUTHOR BASED ON LOTKAS LAW No. of authors Observed Number of authors with n or (an) or (f) Observed percentage of authors 100 x an / a1 Expected number of authors (an=an/n2 )or(p) (F- P)^2/P 1 1131 100.00 1131.00 0.00 2 1395 123.34 348.75 3138.75 3 1183 104.60 131.44 8412.44 4 793 70.11 49.56 11151.56 5 491 43.41 19.64 11312.64 6 273 24.14 7.58 9289.58 7 130 11.49 2.65 6112.65 8 78 6.90 1.22 4837.22 9 46 4.07 0.57 3634.57 10+ 72 6.37 0.72 7056.72 Total 5592 1693.13 64946.14
  • 15. Price's Square Root law, which states that half (50%) of the literature on a subject will be contributed by the square root of total number of authors publishing in that area. PRICES SQUARE ROOT LAW
  • 16. Pareto Principle (80/20 Rule) states that, for many events, roughly 80% of the effects come from 20% of the causes. The original observation was in connection with income and wealth. Pareto noticed that 80% of Italy's wealth was owned by 20% of the population. He then carried out surveys on a variety of other countries and found to his surprise that a similar distribution applied. PARETO PRINCIPLE (80/20 RULE) AND COLLABORATIVE INDEX
  • 17. Bradfords law is to explain that a group of journals could be arranged in an order of decreasing productivity and showed that journals which field most productive articles are coming first and the most unproductively in the last. According to this journals are to be grouped into a number of zones each producing a similar number of articles. However the number of journals in each zone well be increasing rapidly. Then the relationship between the zones is 1:n:n2 . According to Bradfords distribution, the relationship between the zone is 1:n:n2 contrastingly the relationship in each of the present study. BRADFORDS LAW OF SCATTERING JOURNALS
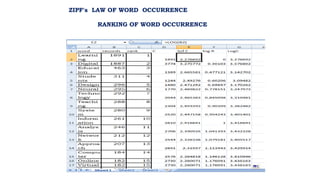
  • 18. ZIPF's LAW OF WORD OCCURRENCE RANKING OF WORD OCCURRENCE