Renewable Energy Global Overview
ŌĆóDownload as PPTX, PDFŌĆó
0 likesŌĆó61 views

This overview is offering general information regarding renewable energy generation and its trends in the last 10 years


Renewable Energy Global Overview
- 1. Renewable Energy Global Overview 2018-2019 Visualization and Graphics : ren21.net By : Hesam Hashemi www.Nexgcg.com
- 2. The greatest portion of the modern renewable share was renewable thermal energy (an estimated 4.2% of TFEC), followed by hydropower (3.6%), other renewable power sources including wind power and solar PV (2%), and transport biofuels (about 1%)
- 3. The overall share of renewable energy (both modern renewables and traditional biomass) in TFEC has increased only gradually, averaging 0.8% annually between 2006 and 2016.
- 4. Nearly two-thirds (64%) of net installations in 2018 were from renewable sources of energy, marking the fourth consecutive year that net additions of renewable power were above 50%.
- 5. As of the end of 2016, heating and cooling accounted for around 51% of final energy use, transport for 32%, and final electricity demand (excluding the purposes of heating, cooling or transport) for around 17%.
- 6. Global subsidies for fossil fuel consumption reached an estimated USD 300 billion in 2017. In addition, one estimate places the true cost of fossil fuels at upwards of USD 5.2 trillion. At least 115 countries in 2017, with at least 73 countries providing subsidies of more than USD 100 million each.
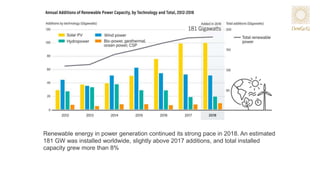
- 7. Renewable energy in power generation continued its strong pace in 2018. An estimated 181 GW was installed worldwide, slightly above 2017 additions, and total installed capacity grew more than 8%
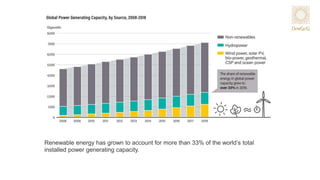
- 8. Renewable energy has grown to account for more than 33% of the worldŌĆÖs total installed power generating capacity.
- 9. Hydropower still accounted for some 60% of renewable electricity production in 2018, followed by wind power (21%), solar PV (9%) and bio-power (8%).Overall, the installed renewable power capacity at year's end was enough to supply around 26.2% of global electricity production.
- 10. 17 countries have more than 10 GW combined of wind power, solar PV, bio-power and geothermal power. In 2018, the top countries for non-hydro capacity were China, the United States and Germany (all over 100 GW), followed by India and Japan, then the United Kingdom, Italy and Brazil/Spain. The top countries for non-hydro renewable power capacity per inhabitant were Iceland, Denmark, Germany, Sweden and Finland.
- 11. Electricity from variable wind energy and solar PV achieved high penetration levels in several countries in 2018. Variable renewables met high shares of generation in Denmark (51%), Uruguay (36%), Ireland (29%), Germany (26%) and Portugal (24%), and overall at least nine countries produced more than 20% of their electricity from VRE in 2018
- 12. Solar photovoltaics (PV) was again the largest employer of all renewable energy industries in 2018, followed by biofuels, hydropower, wind power, and solar heating and cooling.