Report Card
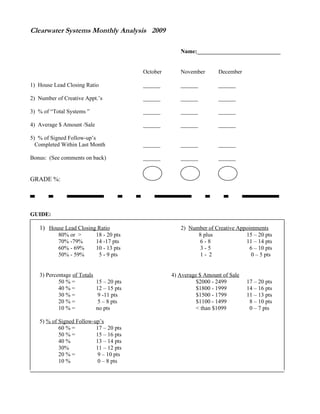
- 1. Clearwater Systems Monthly Analysis 2009 Name:_____________________________ October November December 1) House Lead Closing Ratio ______ ______ ______ 2) Number of Creative Appt.’s ______ ______ ______ 3) % of “Total Systems ” ______ ______ ______ 4) Average $ Amount /Sale ______ ______ ______ 5) % of Signed Follow-up’s Completed Within Last Month ______ ______ ______ Bonus: (See comments on back) ______ ______ ______ GRADE %: GUIDE: 1) House Lead Closing Ratio 2) Number of Creative Appointments 80% or > 18 - 20 pts 8 plus 15 – 20 pts 70% -79% 14 -17 pts 6-8 11 – 14 pts 60% - 69% 10 - 13 pts 3-5 6 – 10 pts 50% - 59% 5 - 9 pts 1- 2 0 – 5 pts 3) Percentage of Totals 4) Average $ Amount of Sale 50 % = 15 – 20 pts $2000 - 2499 17 – 20 pts 40 % = 12 – 15 pts $1800 - 1999 14 – 16 pts 30 % = 9 -11 pts $1500 - 1799 11 – 13 pts 20 % = 5 – 8 pts $1100 - 1499 8 – 10 pts 10 % = no pts < than $1099 0 – 7 pts 5) % of Signed Follow-up’s 60 % = 17 – 20 pts 50 % = 15 – 16 pts 40 % 13 – 14 pts 30% 11 – 12 pts 20 % = 9 – 10 pts 10 % 0 – 8 pts
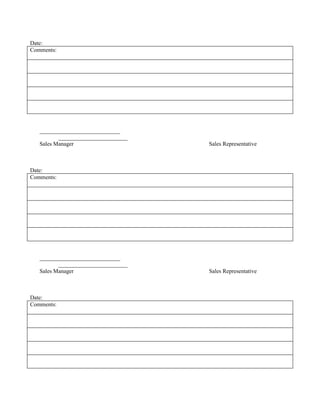
- 2. Date: Comments: ____________________________ ________________________ Sales Manager Sales Representative Date: Comments: ____________________________ ________________________ Sales Manager Sales Representative Date: Comments:
- 3. ____________________________ ________________________ Sales Manager Sales Representative


