Reporting ServicesŌĆÖde SQL Server 2008 R2 ile Gelen Yenilikler
- 2. ŌĆó Rapor Haz─▒rlamada Yenilikler ŌĆó Rapor Eri┼¤iminde Yenilikler ŌĆó Rapor Y├Čnetiminde Yenilikler ŌĆó Geli┼¤tiriciler i├¦in Yenilikler
- 3. ŌĆó Expressions ŌĆó Rapor Ekran─▒ ├¢zellikleri ŌĆó Veri G├Črselle┼¤tirme(Data Visualization) ŌĆó Payla┼¤─▒lan Bile┼¤enler (Shared Components) ŌĆó ATOM Data Feeds ŌĆó SharePoint Listeleri ŌĆó Report Builder 3.0
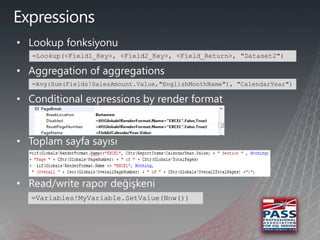
- 4. ŌĆó =Lookup(<Field1_Key>, <Field2_Key>, <Field_Return>, "Dataset2") ŌĆó =Avg(Sum(Fields!SalesAmount.Value,"EnglishMonthName"), "CalendarYear") ŌĆó ŌĆó ŌĆó =Variables!MyVariable.SetValue(Now())
- 5. ŌĆó ŌĆó ŌĆó
- 6. Veri G├Črselle┼¤tirme (Data Visualization) ŌĆó ŌĆó ŌĆó ŌĆó
- 7. ŌĆó ŌĆó
- 8. ŌĆó ŌĆó
- 9. ŌĆó ŌłÆ ŌłÆ ŌĆó ŌłÆ ŌłÆ ŌĆó ŌłÆ ŌłÆ ŌłÆ ŌĆó ŌłÆ ŌłÆ
- 10. ŌĆó ŌłÆ ŌłÆ ŌĆó ŌłÆ ŌłÆ ŌĆó ŌłÆ ŌłÆ
- 11. ŌĆó Rapor Haz─▒rlamada Yenilikler ŌĆó Rapor Eri┼¤iminde Yenilikler ŌĆó Rapor Y├Čnetiminde Yenilikler ŌĆó Geli┼¤tiriciler i├¦in Yenilikler
- 12. ŌĆó Report Manager ŌĆó Report Viewer
- 13. ŌĆó Rapor Haz─▒rlamada Yenilikler ŌĆó Rapor Eri┼¤iminde Yenilikler ŌĆó Rapor Y├Čnetiminde Yenilikler ŌĆó Geli┼¤tiriciler i├¦in Yenilikler
- 14. ŌĆó ŌłÆ ŌłÆ ŌĆó ŌłÆ ŌłÆ ŌłÆ ŌĆó ŌłÆ ŌłÆ
- 15. ŌĆó Rapor Haz─▒rlamada Yenilikler ŌĆó Rapor Eri┼¤iminde Yenilikler ŌĆó Rapor Y├Čnetiminde Yenilikler ŌĆó Geli┼¤tiriciler i├¦in Yenilikler
- 16. ŌĆó ŌłÆ ŌłÆ ŌłÆ ŌłÆ ŌĆó ŌłÆ ŌłÆ ŌłÆ ŌĆó ŌłÆ ŌłÆ
- 17. ŌĆó SQL Server 2008 R2 Books Online: What's New (Reporting Services) http://msdn.microsoft.com/en-us/library/ms170438(SQL.105).aspx
Editor's Notes
- Lookup Functions: Three new lookup functions let you combine data from two different datasets. You can use them to match up values in separate datasets. Your choice of which to use depends on whether there is a 1:1 relationship between the values in each dataset: Lookup: One-to-one relationship between the source and destination;matches one source value to one destination value at a time.MultiLookup : One-to-one relationship between the source and destination; input is a set of source values that Reporting Services matches in the destination and returns matches as an array. LookupSet: One-to-many relationship between the source and destination values; input is a single value from the source dataset, and output is an array of matching values from the destination dataset.Aggregation of Aggregations: You can now use the result of an aggregate function as input to another aggregate function. In addition, you can now sort by aggregated values. Previously, you had to compute these aggregations in the dataset or in a cube.Conditional Expressions by Render Format: In R2, you can use a new global variable, RenderFormat, to control the look and feel of a report based on the rendering extension used. Simply reference the name of the extension as found in the RSReportServer.config file in an expression such as: =iif(RenderFormat.Name┬Ā="EXCEL", True, False). Overall Page Count: Use the new Globals!OverallPageNumber and Globals!OverallTotalPages variables to display the current page number relative to the entire report and the total page count, respectively. You can use these global variables in page headers and page footers only. Read/Write Report Variable: Reporting Services 2008 R2 also features new support for setting the value of a report variable. In previous versions of Reporting Services, you use a report variable when you have a value with a dependency on the execution time, but Reporting Services stores the time at the time of report execution and persists that value as the report continues to process. For example, as a user pages through the report, the variable remains constant even if the actual page rendering time varies from page to page. The report variable is read-only by default, but you can make it read/write by clearing the default value in the variable definition. Then to write to your report variable, you use the SetValue method of the variable.
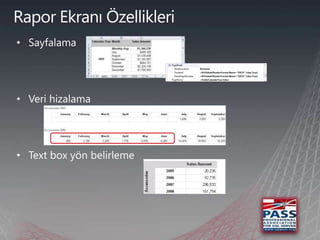
- Pagination: You can set properties to control whether to disable page break settings under certain conditions, reset the page count to 0, and to set a page name for Excel rendering. Data alignment: The DomainScopeproperty for a group lets you fill in the gaps of missing data across multiple instances of the same grouping. Just set the property value to the name of the data region that contains the groupŌĆÖs data region. Text box orientation: The WritingMode property for a text box by default displays text horizontally. You can now set this property to a new value, Rotate270, to render the text in a vertical layout from bottom to top, as shown in the slide.
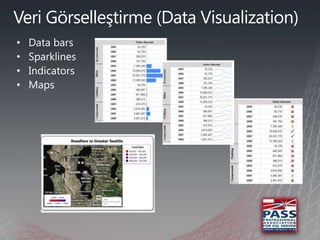
- Data bars: A data bar is a special type of chart that shows a single data point as a horizontal bar or as a vertical column. The length of each bar lets you visually assess whether a group is closer to the minimum or the maximum or some ratio between.Sparklines: Whereas a data bar usually shows a single point, a sparkline shows multiple data points over time to make it easier to spot trends. A sparkline shows whether the measurement is trending up or trending down and the amount of fluctuation during the represented time period. Indicators: You can now add indicators to a report, choosing indicator icons from built-in sets, customizing these sets to change properties such as the color or size of an indicator icon, or even creating your own icons. Maps: You can create many different types of maps in Reporting Services. A wizard gets you started by prompting you for the map you want to use, a shapefile, or spatial data. You can also include analytical data with your map to represent points or areas, using different colors or markers to illustrate the differences between the locations.
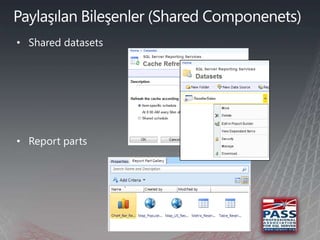
- Shared datasets: A shared dataset lets you define a query once and then reuse it many times in different reports. You can also configure a cache refresh for the dataset in lieu of scheduling a subscription by using the NULL delivery provider to warm up the cache. If the report has parameters, you must specify the default value for each parameter. If you want to warm the cache for various combinations of parameters, just configure another cache refresh plan for each combination.Report parts: You can publish selected data regions as separate components that other report developers can use to jump-start reports and to maintain consistency in design. Report developers can locate the available report parts in the Report Part Gallery, a new feature exclusive to Report Builder 3.0.
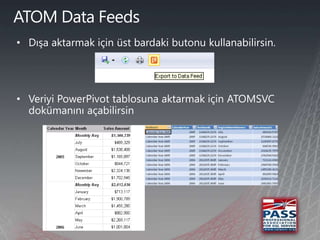
- Reporting Services 2008 R2 includes a new rendering extension to support exporting report data to an ATOM service document. An ATOM service document can be used by any application that consumes data feeds. The data feeds in Reporting Services are useful for use in Microsoft PowerPivot, but you can use this feature to meet other requirements where you need to provide raw data via a feed.Note: To import data into a PowerPiovt table, you must have PowerPivot for Excel installed.
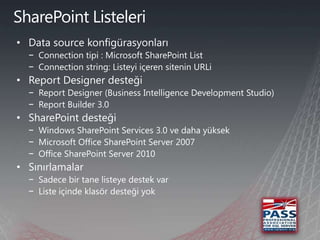
- In previous releases of Reporting Services, you could not access SharePoint lists directly; instead, you could use the XML Data Provider to call the SharePoint Web service. So this R2 feature is a huge step forward. A graphical query designer displays the available lists and lets you select all fields in a list, view properties as tooltips, apply filters, and run the query to see the data from the list. Note that you can access only one list at a time and that you cannot retrieve data from a list if it stores items in folders.
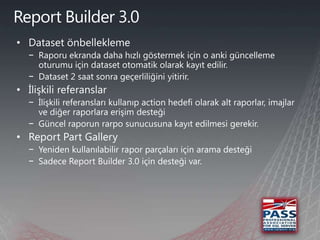
- Report Builder 3.0 is the third iteration of the ad hoc report development tool intended for power users rather than professional report developers. This version of the tool includes improvements intended to speed up the report development process:Dataset caching: Report Builder 3.0 now operates as an edit session on the report server if you perform your development work while connected to the report server. The main benefit of the edit session is to speed up the preview process and render reports faster. The report server saves cached datasets for the edit session; these datasets are then reused when you preview the report and have made report changes affecting the layout only.Relative references: Another benefit of the edit session is the ability to use relative references in expressions. Relative references let you specify the path to subreports, images, and other reports that you might configure as a target for the Jump To action relative to the current reportŌĆÖs location on the report server. Report Part Gallery: As mentioned earlier, the Report Part Gallery is available only in Report Builder 3.0 and lets you type a string value and search for report parts published to the report server where the name or the description of the report part contains the search string.
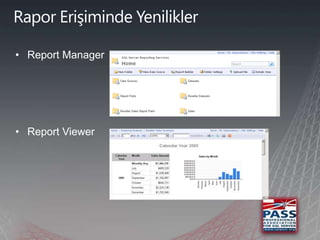
- Report Manager:Report Manager has the first makeover since its first release with an improved layout and color scheme. To access report properties and settings, you no longer open the report first, but instead click a command on the drop-down list for the report. Report Viewer: All the space at the top of the screen has been eliminated. The toolbar has eliminated the drop-down list for the export formats and replaced it with an icon that includes a drop-down list.
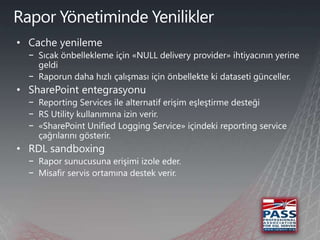
- Cache refresh: By storing the report in cache, Reporting Services can respond to a report request faster, but cache storage is not unlimited. Periodically, the cache expires, and the next person that requests the report has to wait for the report execution process to complete. A workaround for this scenario is to create a subscription that uses the NULL delivery provider, but now in Reporting Services 2008 R2, a better solution is available. A new feature called cache refresh lets you establish a schedule to load reports into cache and to configure cache refresh to load shared datasets into cache to extend the performance benefit to multiple reports. If the report has parameters, you must specify the default value for each parameter. If you want to warm the cache for various combinations of parameters, just configure another cache refresh plan for each combination. You can also use cache refresh to update data for Shared Datasets which in turn can be used to populate parameters.SharePoint integration: Alternate access mappings - Alternate access mappings let users from multiple zones, such as the Internet and the intranet, access the same report items by using different URLs. You can configure up to five different URLs to access a single Web application that provides access to Reporting Services content, with each URL using a different authentication provider. This functionality is important when you want to use Windows authentication for intranet users and Forms authentication for Internet users.RS Utility - Report server administrators use the RS.EXE utility frequently to perform repetitive administrative tasks, such as bulk deployment of reports to the server and bulk configuration of report properties. This utility is now supported in integrated mode.SharePoint Unified Logging Service - In SharePoint integrated mode, you now have the option to view log information by using the SharePoint Unified Logging Service. Having all SharePoint-related activity, including the report server, in one location should help the troubleshooting process.RDL sandboxing: When you grant external users access to a report server, the security risks multiply enormously, and additional steps must be taken to mitigate those risks. Reporting Services now supports configuration changes on the report server to isolate access to resources on the server as an important part of a threat-mitigation strategy. Resource isolation is a common requirement for hosted services that have multiple tenants on the same server. Essentially, the configuration changes let you restrict which external resources can be accessed by the server, such as images, XLST files, maps, or data sources. You can also restrict the resource types used in expressions by namespace and by member and check reports as they are deployed to ensure the restricted types are not in use. In addition, you can restrict the text length and the size of an expressionŌĆÖs return value when a report executes. With sandboxing, reports cannot include custom code in the Code block, nor can reports include 2005 custom report items or references to named parameters in expressions. The trace log will capture any activity related to sandboxing and should be monitored frequently for evidence of potential threats.
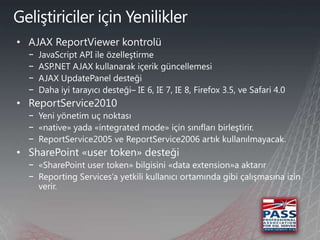
- AJAX ReportViewer control: The most notable change for the ReportViewer control for the Web is that it is now an AJAX-enabled control. You can also customize the UI with JavaScript, which we will discuss in Topic 06, Embedding Reporting into Applications. In addition, local mode now provides the same experience as server mode for rendering, exporting, and support for the 2008 schema, which introduced the tablix, the gauge, and rich text support. Note that if you use server mode, the report server must be Reporting Services 2008 or higher.ReportService2010: The ReportService2010 endpoint consolidates the ReportService2005 and ReportService2006 endpoints so that now only one endpoint is required for interactivity with report server objects. ReportService2005 and ReportService2006 are now deprecated. SharePoint user token: Containing identification and group membership of a user, the SharePoint user token lets the application perform authorized activity in the context of that user.
- ║▌║▌▀Ż ObjectiveProvide an opportunity to tee up some of the trends we see that will be addressed later in the deck.The business requirements are trends we see impacting our customerŌĆÖs requirements.The technology changes are technology trends that we see having a significant impact.Feel free to skip this slide or just touch on it quickly if your audience is already familiar with these trends.║▌║▌▀Ż ScriptAs we look to the future to plan the next versions of SQL Server we take a careful look at bothThe business trends that are changing our customerŌĆÖs requirements; andThe technology trends that will create new opportunities and challenges in the futureBefore discussing the product investments weŌĆÖre considering weŌĆÖd like to take a moment to discuss some of the trends we see being particularly impactful in the coming yearsAs we engage with customers, we learn about the pressures to deliver more real-time information through rich applications while also reducing costs in this new economy. You need a complete approach to managing, accessing and delivering information across your organization to accelerate and improve business decisions. GlobalizationThis is not a new trend but it is one that continues to impact business requirements. As companies centralize distributed operations or grow and acquire more global assets it often drives greater scalability requirements for core corporate applications like ERP.As companies do business in more time zones and increasingly 24x7 online it increases availability requirements including the need to minimize and/or eliminate planned downtime for maintenance.The information platform of the future needs to deliver the scalability and availability to meet these requirements.Consumerization of IT and Web 2.0 Experiences in BusinessToday we all have experience using Internet search to find precise answers to questions instantly and to instantly have access to our personal finance data and yet in a work/business context we are often unable to answer even the most basic questions about our business. This growing disparity in experience between the consumer and business worlds is leading to a user driven demand for business experiences that more closely mirror the experiences users have in their consumer life.Right Information at the Right TimeItŌĆÖs no longer good enough to simply keep the business running. There are much higher expectations to create competitive advantage by leveraging the organizationŌĆÖs data.As it becomes more and more feasible to capture, store and analyze increasing volumes of data from increasingly diverse sources those companies that can create competitive advantage by extracting the right information from their data and make it available to people in their organization at the right time will succeed. It should come as no surprise that BI is the #1 priority of many leading CIOs. The informationplatform of the future needs to enable people to leverage all of their data for business advantage in a timely way.IT Agility and Cost EfficiencyThere continues to be cost pressure on IT to increase resource utilization and to manage increasing workloads without increasing staff. We see that today in the strong focus on driving up server utilization through server consolidation enabled by virtualization.At the same time there is increasing pressure to be more agile ŌĆō to respond to new business needs more quickly and yet 60% of IT budgets are consumed just keeping things running.The data platform of the future needs to deliver high levels of resource utilization, exploit commodity hardware trends, deliver increasing scale without increasing staff and accelerate the delivery of new business solutions.These are big challenges.Thankfully there are some key technology drivers that will change whatŌĆÖs possibleDigitally Born DataAs more and more data is created digitally it becomes possible to have a single data platform to provide an integrated set of services over all your data.VirtualizationBy decoupling the binding between physical and logical resources at many levels (OS/Server Hardware, LUN/physical storage, application/data platform) it becomes possible to provide a much higher level of agility in managing the IT infrastructure.Hardware InnovationLow Cost Highly Capable CPUs: MooreŌĆÖs law is still at work and the cost of CPUs is still coming down but instead of increasing clock speeds we now have increasing #s of cores in multi-core processors. The challenge now is to re-architect software applications for greater parallelism in order to exploit the increasing # of cores.Memory ŌĆō Increased Capacity at Lower Cost: Servers can now be configured with 1TB of RAM. This changes the historical design trade-offs made between memory and persisted storage and offers opportunities for new capabilities by optimizing for large memory. This will fundamentally change the I/O characteristics of database systems and enable new architectures that exploit the reduced latency. PowerPivot is an early example of whatŌĆÖs possible here.Raw Storage Costs Continue to Drop: Low cost, industry standard storage wins. ItŌĆÖs possible now to get 1TB of raw storage for < $300. The challenge now is to reduce the operational costs of managing the storage.Smaller More Powerful Form Factors CPU and Storage are becoming available in smaller and more powerful form factors increasing the capability of computing at the edge including mobile and embedded devices ŌĆō it will become increasingly feasible and desirable to have systems where data is distributed to enable more timely decisions and actions to be made where the actionŌĆÖs happeningIncreasing Energy costs and Environmental Concerns are going to continue to yield hardware innovations that enable dynamic management of power ŌĆō taking advantage of this while still delivering optimal performance will require a new relationship between the database and the resources provided by the underlying OS and hardware ŌĆō a relationship that provides bi-directional information about current and future needs and the difference between the currently supplied resources and the total resources available.Cloud ServicesThe Internet represents an opportunity to revolutionize the way data is accessed and processed in much the same way that the standardization of network transport protocols helped push formerly tightly coupled databases and the applications that used them onto separate machines in the 1980s. The greatest impact that services will have on business will come from the inevitable shift toward utility computing within the enterprise. The same platform-level investments we are making in the Cloud will help our enterprise customers embrace utility computing. With the launch of Windows Azure and SQL Azure we are already seeing increasing acceptance of cloud services for business workloads.

