Research360 Overview
âĒ
1 likeâĒ427 views

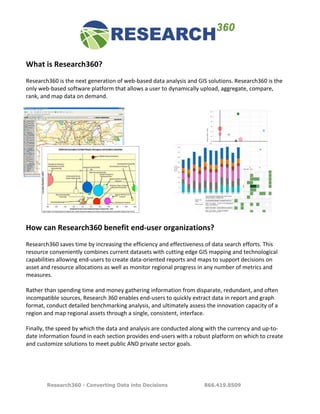
Research360 is a next generation web-based data analysis and GIS solution that allows users to dynamically upload, aggregate, compare, rank and map data on demand. It saves time for end-user organizations by increasing the efficiency of data search efforts and enabling quick extraction of data, reports and maps to support decision making through a single consistent interface. Some immediate returns on investment include asset mapping, benchmarking, trends analysis, identification of opportunities and streamlining use of internal data.

Research360 Overview
- 1. Ėý Ėý Ėý Ėý Ėý Ėý Ėý Ėý Ėý Ėý Ėý Ėý Ėý What Ėýis ĖýResearch360? Ėý Ėý Research360 Ėýis Ėýthe Ėýnext Ėýgeneration Ėýof Ėýweb-Ââbased Ėýdata Ėýanalysis Ėýand ĖýGIS Ėýsolutions. ĖýResearch360 Ėýis Ėýthe Ėý only Ėýweb-Ââbased Ėýsoftware Ėýplatform Ėýthat Ėýallows Ėýa Ėýuser Ėýto Ėýdynamically Ėýupload, Ėýaggregate, Ėýcompare, Ėý rank, Ėýand Ėýmap Ėýdata Ėýon Ėýdemand. Ėý Ėý Ėý Ėý Ėý Ėý Ėý Ėý Ėý Ėý Ėý Ėý Ėý Ėý Ėý Ėý Ėý How Ėýcan ĖýResearch360 Ėýbenefit Ėýend-Ââuser Ėýorganizations? Ėý Ėý Research360 Ėýsaves Ėýtime Ėýby Ėýincreasing Ėýthe Ėýefficiency Ėýand Ėýeffectiveness Ėýof Ėýdata Ėýsearch Ėýefforts. ĖýThis Ėý resource Ėýconveniently Ėýcombines Ėýcurrent Ėýdatasets Ėýwith Ėýcutting Ėýedge ĖýGIS Ėýmapping Ėýand Ėýtechnological Ėý capabilities Ėýallowing Ėýend-Ââusers Ėýto Ėýcreate Ėýdata-Ââoriented Ėýreports Ėýand Ėýmaps Ėýto Ėýsupport Ėýdecisions Ėýon Ėý asset Ėýand Ėýresource Ėýallocations Ėýas Ėýwell Ėýas Ėýmonitor Ėýregional Ėýprogress Ėýin Ėýany Ėýnumber Ėýof Ėýmetrics Ėýand Ėý measures. Ėý Ėý Rather Ėýthan Ėýspending Ėýtime Ėýand Ėýmoney Ėýgathering Ėýinformation Ėýfrom Ėýdisparate, Ėýredundant, Ėýand Ėýoften Ėý incompatible Ėýsources, ĖýResearch Ėý360 Ėýenables Ėýend-Ââusers Ėýto Ėýquickly Ėýextract Ėýdata Ėýin Ėýreport Ėýand Ėýgraph Ėý format, Ėýconduct Ėýdetailed Ėýbenchmarking Ėýanalysis, Ėýand Ėýultimately Ėýassess Ėýthe Ėýinnovation Ėýcapacity Ėýof Ėýa Ėý region Ėýand Ėýmap Ėýregional Ėýassets Ėýthrough Ėýa Ėýsingle, Ėýconsistent, Ėýinterface. Ėý Ėý Ėý Ėý Finally, Ėýthe Ėýspeed Ėýby Ėýwhich Ėýthe Ėýdata Ėýand Ėýanalysis Ėýare Ėýconducted Ėýalong Ėýwith Ėýthe Ėýcurrency Ėýand Ėýup-Ââto-Ââ date Ėýinformation Ėýfound Ėýin Ėýeach Ėýsection Ėýprovides Ėýend-Ââusers Ėýwith Ėýa Ėýrobust Ėýplatform Ėýon Ėýwhich Ėýto Ėýcreate Ėý and Ėýcustomize Ėýsolutions Ėýto Ėýmeet Ėýpublic ĖýAND Ėýprivate Ėýsector Ėýgoals. Ėý Ėý Ėý Ėý Research360 - Converting Data into Decisions 866.419.8509
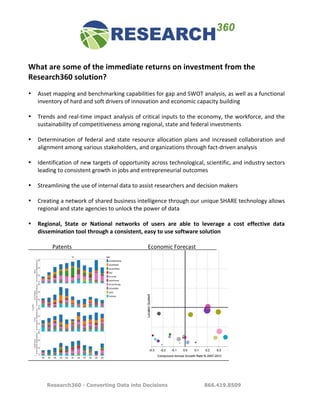
- 2. Ėý What Ėýare Ėýsome Ėýof Ėýthe Ėýimmediate Ėýreturns Ėýon Ėýinvestment Ėýfrom Ėýthe Ėý Research360 Ėýsolution? Ėý Ėý âĒ Asset Ėý mapping Ėý and Ėý benchmarking Ėý capabilities Ėý for Ėý gap Ėý and Ėý SWOT Ėý analysis, Ėý as Ėý well Ėý as Ėý a Ėý functional Ėý inventory Ėýof Ėýhard Ėýand Ėýsoft Ėýdrivers Ėýof Ėýinnovation Ėýand Ėýeconomic Ėýcapacity Ėýbuilding Ėý Ėý âĒ Trends Ėýand Ėýreal-Ââtime Ėýimpact Ėýanalysis Ėýof Ėýcritical Ėýinputs Ėýto Ėýthe Ėýeconomy, Ėýthe Ėýworkforce, Ėýand Ėýthe Ėý sustainability Ėýof Ėýcompetitiveness Ėýamong Ėýregional, Ėýstate Ėýand Ėýfederal Ėýinvestments Ėý Ėý âĒ Determination Ėý of Ėý federal Ėý and Ėý state Ėý resource Ėý allocation Ėý plans Ėý and Ėý increased Ėý collaboration Ėý and Ėý alignment Ėýamong Ėývarious Ėýstakeholders, Ėýand Ėýorganizations Ėýthrough Ėýfact-Ââdriven Ėýanalysis Ėý Ėý âĒ Identification Ėýof Ėýnew Ėýtargets Ėýof Ėýopportunity Ėýacross Ėýtechnological, Ėýscientific, Ėýand Ėýindustry Ėýsectors Ėý leading Ėýto Ėýconsistent Ėýgrowth Ėýin Ėýjobs Ėýand Ėýentrepreneurial Ėýoutcomes Ėý Ėý âĒ Streamlining Ėýthe Ėýuse Ėýof Ėýinternal Ėýdata Ėýto Ėýassist Ėýresearchers Ėýand Ėýdecision Ėýmakers Ėý Ėý Ėý âĒ Creating Ėýa Ėýnetwork Ėýof Ėýshared Ėýbusiness Ėýintelligence Ėýthrough Ėýour Ėýunique ĖýSHARE Ėýtechnology Ėýallows Ėý regional Ėýand Ėýstate Ėýagencies Ėýto Ėýunlock Ėýthe Ėýpower Ėýof Ėýdata Ėý Ėý âĒ Regional, Ėý State Ėý or Ėý National Ėý networks Ėý of Ėý users Ėý are Ėý able Ėý to Ėý leverage Ėý a Ėý cost Ėý effective Ėý data Ėý dissemination Ėýtool Ėýthrough Ėýa Ėýconsistent, Ėýeasy Ėýto Ėýuse Ėýsoftware Ėýsolution Ėý Ėý Ėý Ėý Ėý Ėý Ėý Ėý Ėý Ėý Ėý Ėý Ėý Ėý Ėý Ėý Ėý Ėý ĖýPatents Ėý Ėý Ėý Ėý Ėý Ėý Ėý Ėý Ėý Ėý Ėý Ėý Ėý Ėý Ėý Ėý Ėý Ėý Ėý Ėý ĖýEconomic ĖýForecast Ėý Ėý Ėý Ėý Ėý Ėý Ėý Ėý Ėý Ėý Ėý Ėý Ėý Ėý Ėý Ėý Ėý Ėý Ėý Ėý Ėý Ėý Ėý Ėý Ėý Research360 - Converting Data into Decisions 866.419.8509
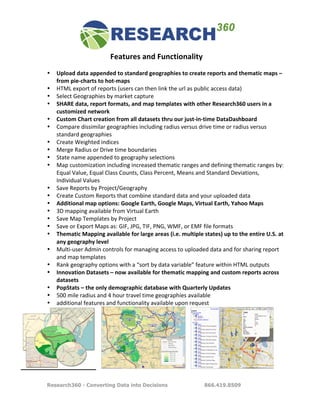
- 3. Features Ėýand ĖýFunctionality Ėý Ėý âĒ Upload Ėýdata Ėýappended Ėýto Ėýstandard Ėýgeographies Ėýto Ėýcreate Ėýreports Ėýand Ėýthematic Ėýmaps Ėýâ Ėý from Ėýpie-Ââcharts Ėýto Ėýhot-Ââmaps Ėý âĒ HTML Ėýexport Ėýof Ėýreports Ėý(users Ėýcan Ėýthen Ėýlink Ėýthe Ėýurl Ėýas Ėýpublic Ėýaccess Ėýdata) Ėý âĒ Select ĖýGeographies Ėýby Ėýmarket Ėýcapture Ėý âĒ SHARE Ėýdata, Ėýreport Ėýformats, Ėýand Ėýmap Ėýtemplates Ėýwith Ėýother ĖýResearch360 Ėýusers Ėýin Ėýa Ėý customized Ėýnetwork Ėý âĒ Custom ĖýChart Ėýcreation Ėýfrom Ėýall Ėýdatasets Ėýthru Ėýour Ėýjust-Ââin-Ââtime ĖýDataDashboard Ėý âĒ Compare Ėýdissimilar Ėýgeographies Ėýincluding Ėýradius Ėýversus Ėýdrive Ėýtime Ėýor Ėýradius Ėýversus Ėý standard Ėýgeographies Ėý âĒ Create ĖýWeighted Ėýindices Ėý âĒ Merge ĖýRadius Ėýor ĖýDrive Ėýtime Ėýboundaries Ėý âĒ State Ėýname Ėýappended Ėýto Ėýgeography Ėýselections Ėý âĒ Map Ėýcustomization Ėýincluding Ėýincreased Ėýthematic Ėýranges Ėýand Ėýdefining Ėýthematic Ėýranges Ėýby: Ėý Equal ĖýValue, ĖýEqual ĖýClass ĖýCounts, ĖýClass ĖýPercent, ĖýMeans Ėýand ĖýStandard ĖýDeviations, Ėý Individual ĖýValues Ėý âĒ Save ĖýReports Ėýby ĖýProject/Geography Ėý âĒ Create ĖýCustom ĖýReports Ėýthat Ėýcombine Ėýstandard Ėýdata Ėýand Ėýyour Ėýuploaded Ėýdata Ėý âĒ Additional Ėýmap Ėýoptions: ĖýGoogle ĖýEarth, ĖýGoogle ĖýMaps, ĖýVirtual ĖýEarth, ĖýYahoo ĖýMaps Ėý âĒ 3D Ėýmapping Ėýavailable Ėýfrom ĖýVirtual ĖýEarth Ėý âĒ Save ĖýMap ĖýTemplates Ėýby ĖýProject Ėý âĒ Save Ėýor ĖýExport ĖýMaps Ėýas: ĖýGIF, ĖýJPG, ĖýTIF, ĖýPNG, ĖýWMF, Ėýor ĖýEMF Ėýfile Ėýformats Ėý âĒ Thematic ĖýMapping Ėýavailable Ėýfor Ėýlarge Ėýareas Ėý(i.e. Ėýmultiple Ėýstates) Ėýup Ėýto Ėýthe Ėýentire ĖýU.S. Ėýat Ėý any Ėýgeography Ėýlevel Ėý âĒ Multi-Ââuser ĖýAdmin Ėýcontrols Ėýfor Ėýmanaging Ėýaccess Ėýto Ėýuploaded Ėýdata Ėýand Ėýfor Ėýsharing Ėýreport Ėý and Ėýmap Ėýtemplates Ėý âĒ Rank Ėýgeography Ėýoptions Ėýwith Ėýa Ėýâsort Ėýby Ėýdata Ėývariableâ Ėýfeature Ėýwithin ĖýHTML Ėýoutputs Ėý âĒ Innovation ĖýDatasets Ėýâ Ėýnow Ėýavailable Ėýfor Ėýthematic Ėýmapping Ėýand Ėýcustom Ėýreports Ėýacross Ėý datasets Ėý âĒ PopStats Ėýâ Ėýthe Ėýonly Ėýdemographic Ėýdatabase Ėýwith ĖýQuarterly ĖýUpdates Ėý âĒ 500 Ėýmile Ėýradius Ėýand Ėý4 Ėýhour Ėýtravel Ėýtime Ėýgeographies Ėýavailable Ėý âĒ additional Ėýfeatures Ėýand Ėýfunctionality Ėýavailable Ėýupon Ėýrequest Ėý Ėý Ėý Ėý Ėý Ėý Ėý Ėý Research360 - Converting Data into Decisions 866.419.8509
- 4. Ėý Ėý Research ĖýPackage ĖýDescriptions Ėý Ėý Ėý All ĖýPackages Ėýinclude Ėýthe ĖýPRO Ėýversion Ėýof ĖýResearch360, ĖýD&B ĖýBusiness ĖýLocation Ėýdata, Ėýand ĖýNAICS Ėý Business ĖýSummary Ėýdata Ėý Ėý Research360 ĖýAdvantage Ėýâ ĖýWorkforce Ėýand ĖýIndustry ĖýData Ėý Ėý Enhance Ėýyour Ėýworkforce Ėýand Ėýtraining Ėýrelated Ėýdecisions Ėýwith Ėýour ĖýIndustry Ėýand ĖýOccupation/Wage Ėýdata Ėý modules. ĖýAdding Ėýto Ėýthe Ėýdata Ėýand Ėýtechnical Ėýfeatures Ėýavailable Ėýin ĖýResearch360 ĖýProfessional, ĖýAdvantage Ėý offers Ėý current Ėý and Ėý projected Ėý industry Ėý cluster Ėý data Ėý including Ėý location Ėý quotient, Ėý wage Ėý and Ėý occupation Ėý growth Ėýstatistics Ėýproviding Ėýusers Ėýwith Ėýan Ėýeconomic Ėýbarometer Ėýfor Ėýtheir Ėýregion. ĖýIn Ėýaddition, Ėýoccupation Ėý levels Ėý by Ėý standard Ėý occupation Ėý code Ėý help Ėý determine Ėý the Ėý future Ėý workforce Ėý needs Ėý of Ėý emerging Ėý businesses Ėý and Ėý industries. Ėý Armed Ėý with Ėý this Ėý information, Ėý a Ėý region Ėý will Ėý be Ėý able Ėý to Ėý design Ėý more Ėý effective Ėý regional Ėýworkforce Ėýdevelopment Ėýinitiatives Ėýand Ėýa Ėýsuperior Ėýworkforce Ėýdelivery Ėýsystem. Ėý Ėý Ėý Research360 ĖýInnovationEconomy Ėýâ ĖýFederal/State ĖýFunding, ĖýPatents Ėýand ĖýVC Ėý Ėý Our Ėý Research360/ Ėý Innovation360 Ėý package Ėý incorporates Ėý key Ėý datasets Ėý to Ėý our Ėý Professional Ėý solution Ėý by Ėý including Ėý ten Ėý years Ėý worth Ėý of Ėý all Ėý federal Ėý funding Ėý (R&D, Ėý Economic Ėý and Ėý Workforce, Ėý Community Ėý and Ėý Infrastructure, ĖýSmall ĖýBusiness/Entrepreneurial Ėýactivities Ėýâ Ėýsome Ėý600 Ėýprograms Ėýin Ėýtotal), Ėýpatents, Ėýand Ėý venture Ėýcapital Ėýthat Ėýcan Ėýhelp Ėýto Ėýidentify Ėýpotential Ėýgaps Ėýand Ėýweaknesses Ėýas Ėýwell Ėýas Ėýkey Ėýopportunities Ėý and Ėýstrengths. ĖýIn Ėýthis Ėýknowledge-Ââbased Ėýeconomy, Ėýclusters Ėýof Ėýcompetency Ėýin Ėýthe Ėýworkforce Ėýdrive Ėýthe Ėý growth Ėýof Ėýnew Ėýindustries. ĖýIt Ėýis Ėýessential Ėýto Ėýunderstand Ėýwhere Ėýknowledge Ėýis Ėýbeing Ėýcreated, Ėýtransferred, Ėý commercialized, Ėý and Ėý industrialized Ėý when Ėý determining Ėý which Ėý competencies Ėý regional Ėý businesses Ėý will Ėý demand Ėýin Ėýthe Ėýfuture. Ėý Ėý Ėý Research360 ĖýAnalyst Ėý Ėý Ėý Research360 Ėý Analyst Ėý is Ėý the Ėý ultimate Ėý version Ėý of Ėý our Ėý web-Ââbased Ėý GIS Ėý Software, Ėý taking Ėý numerous Ėý sources Ėý of Ėý information Ėý â Ėý Professional Ėý functionality, Ėý NAICS Ėý Business Ėý Summary Ėý and Ėý Location Ėý data, Ėý Industry, Ėý Occupation/Wage, ĖýPatents, ĖýVenture ĖýCapital, Ėýand ĖýFederal ĖýFunding Ėýdata Ėýand Ėýcombining Ėýthem Ėýinto Ėýone Ėý powerful Ėý decision Ėý making Ėý tool. Ėý By Ėý combining Ėý these Ėý tools Ėý and Ėý unique Ėý datasets, Ėý access Ėý to Ėý typical Ėý employment, Ėý wage, Ėý labor-Ââshed Ėý and Ėý other Ėý knowledge Ėý becomes Ėý readily Ėý available Ėý to Ėý decision Ėý makers Ėý at Ėý all Ėý levels. Ėý Analyst Ėý datasets Ėý match Ėý innovation Ėý inputs Ėý with Ėý key Ėý metrics Ėý of Ėý performance, Ėý production, Ėý and Ėý overall Ėýoutputs Ėýfor Ėýaggregating Ėýintelligence Ėýfor Ėýeconomic Ėýand Ėýworkforce Ėýrelated Ėýactivities. Ėý Ėý Ėý Ėý Ėý Ėý Research360 - Converting Data into Decisions 866.419.8509
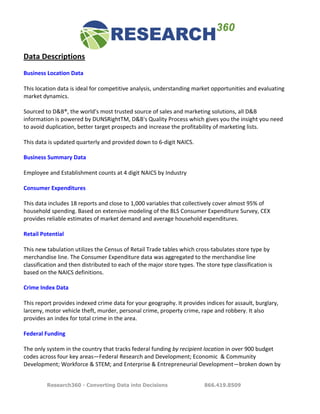
- 5. Data ĖýDescriptions Ėý Ėý Business ĖýLocation ĖýData Ėý Ėý This Ėýlocation Ėýdata Ėýis Ėýideal Ėýfor Ėýcompetitive Ėýanalysis, Ėýunderstanding Ėýmarket Ėýopportunities Ėýand Ėýevaluating Ėý market Ėýdynamics. Ėý Ėý Ėý Sourced Ėýto ĖýD&BÂŪ, Ėýthe Ėýworld's Ėýmost Ėýtrusted Ėýsource Ėýof Ėýsales Ėýand Ėýmarketing Ėýsolutions, Ėýall ĖýD&B Ėý information Ėýis Ėýpowered Ėýby ĖýDUNSRightTM, ĖýD&B's ĖýQuality ĖýProcess Ėýwhich Ėýgives Ėýyou Ėýthe Ėýinsight Ėýyou Ėýneed Ėý to Ėýavoid Ėýduplication, Ėýbetter Ėýtarget Ėýprospects Ėýand Ėýincrease Ėýthe Ėýprofitability Ėýof Ėýmarketing Ėýlists. Ėý Ėý Ėý This Ėýdata Ėýis Ėýupdated Ėýquarterly Ėýand Ėýprovided Ėýdown Ėýto Ėý6-Ââdigit ĖýNAICS. Ėý Ėý Business ĖýSummary ĖýData Ėý Ėý Ėý Employee Ėýand ĖýEstablishment Ėýcounts Ėýat Ėý4 Ėýdigit ĖýNAICS Ėýby ĖýIndustry Ėý Ėý Consumer ĖýExpenditures Ėý Ėý This Ėýdata Ėýincludes Ėý18 Ėýreports Ėýand Ėýclose Ėýto Ėý1,000 Ėývariables Ėýthat Ėýcollectively Ėýcover Ėýalmost Ėý95% Ėýof Ėý household Ėýspending. ĖýBased Ėýon Ėýextensive Ėýmodeling Ėýof Ėýthe ĖýBLS ĖýConsumer ĖýExpenditure ĖýSurvey, ĖýCEX Ėý provides Ėýreliable Ėýestimates Ėýof Ėýmarket Ėýdemand Ėýand Ėýaverage Ėýhousehold Ėýexpenditures. Ėý Ėý Retail ĖýPotential Ėý Ėý This Ėýnew Ėýtabulation Ėýutilizes Ėýthe ĖýCensus Ėýof ĖýRetail ĖýTrade Ėýtables Ėýwhich Ėýcross-Ââtabulates Ėýstore Ėýtype Ėýby Ėý merchandise Ėýline. ĖýThe ĖýConsumer ĖýExpenditure Ėýdata Ėýwas Ėýaggregated Ėýto Ėýthe Ėýmerchandise Ėýline Ėý classification Ėýand Ėýthen Ėýdistributed Ėýto Ėýeach Ėýof Ėýthe Ėýmajor Ėýstore Ėýtypes. ĖýThe Ėýstore Ėýtype Ėýclassification Ėýis Ėý based Ėýon Ėýthe ĖýNAICS Ėýdefinitions. Ėý Ėý Crime ĖýIndex ĖýData Ėý Ėý Ėý This Ėýreport Ėýprovides Ėýindexed Ėýcrime Ėýdata Ėýfor Ėýyour Ėýgeography. ĖýIt Ėýprovides Ėýindices Ėýfor Ėýassault, Ėýburglary, Ėý larceny, Ėýmotor Ėývehicle Ėýtheft, Ėýmurder, Ėýpersonal Ėýcrime, Ėýproperty Ėýcrime, Ėýrape Ėýand Ėýrobbery. ĖýIt Ėýalso Ėý provides Ėýan Ėýindex Ėýfor Ėýtotal Ėýcrime Ėýin Ėýthe Ėýarea. Ėý Ėý Ėý Federal ĖýFunding Ėý Ėý The Ėýonly Ėýsystem Ėýin Ėýthe Ėýcountry Ėýthat Ėýtracks Ėýfederal Ėýfunding Ėýby Ėýrecipient Ėýlocation Ėýin Ėýover Ėý900 Ėýbudget Ėý codes Ėýacross Ėýfour Ėýkey ĖýareasâFederal ĖýResearch Ėýand ĖýDevelopment; ĖýEconomic Ėý Ėý& ĖýCommunity Ėý Development; ĖýWorkforce Ėý& ĖýSTEM; Ėýand ĖýEnterprise Ėý& ĖýEntrepreneurial ĖýDevelopmentâbroken Ėýdown Ėýby Ėý Research360 - Converting Data into Decisions 866.419.8509
- 6. program, Ėýsponsoring Ėýagency, Ėýrecipient, Ėýand Ėýyear. ĖýAlso Ėýincludes Ėý2008-Ââ2010 ĖýStimulus/ARRA Ėýspending Ėýby Ėý agency Ėýand Ėýprogram, Ėýas Ėýwell Ėýas ĖýNational ĖýScience ĖýFoundation Ėýfunding Ėýinitiatives. Ėý Ėý Ėý Patents Ėý Ėý Twenty-Ââfive Ėýyears Ėýof Ėýpatents Ėýcategorized Ėýby Ėýyear, Ėýtech Ėýsector, Ėýand Ėýassignee, Ėýto Ėýidentify Ėýkey Ėý technologies Ėýfor Ėýcommercialization Ėýand Ėýtechnological Ėýstrengths Ėýand Ėýgaps. Ėý Ėý Ėý Ėý Ėý Ėý Ėý Ėý Ėý Venture ĖýCapital Ėý Ėý Identifies ĖýSBIR, Ėýearly-Ââstage/seed Ėýstage, Ėýand Ėýventure Ėýbacked Ėýinvestments Ėýby Ėýtechnology Ėýsector, Ėý recipient Ėýcompany, Ėýand Ėýventure Ėýfirm. Ėý Ėý Employment Ėýand ĖýWages Ėý Ėý Captures Ėýhistorical, Ėýcurrent Ėýand Ėýprojected Ėýemployment Ėýand Ėýwage Ėýdata Ėýdown Ėýto Ėý5 Ėýdigit ĖýNAICS Ėýfor Ėýall Ėý Standard ĖýOccupation ĖýCodes. ĖýCovers Ėýall Ėýcounties Ėýin Ėýthe ĖýU.S. Ėý Ėý Industry ĖýData Ėý Ėý Tracks Ėýcurrent Ėýindustry Ėýemployment, Ėýlocation Ėýquotient, Ėýplus Ėý5 Ėýand Ėý10 Ėý Ėýyear Ėýprojected Ėýgrowth Ėýdata Ėýfor Ėý 400 Ėýindustries. Ėý ĖýCovers Ėýall Ėýcounties Ėýin Ėýthe ĖýU.S. Ėý Ėý State Ėýand ĖýLocal ĖýProcurement ĖýData Ėý(additional Ėýcost) Ėý Ėý In Ėýcooperation Ėýwith ĖýONVIA, Ėýidentifies Ėýthe Ėýpast Ėýseven Ėýyears Ėýworth Ėýof Ėýall Ėýstate, Ėýcounty, Ėýmunicipal, Ėý primary/secondary Ėýeducation, Ėýuniversity Ėýand Ėýcommunity Ėýcollege Ėýprocurement Ėýof Ėýlabor, Ėýmaterials, Ėý equipment, Ėýand Ėýservices Ėýâ Ėýincluding Ėýmost Ėýrecent ĖýARRA Ėýexpenditures. Ėý Ėý Ėý Corporate Ėýand ĖýPhilanthropic ĖýGiving Ėý(additional Ėýcost) Ėý Ėý In Ėýcooperation Ėýwith ĖýGrantStation, Ėýidentifies Ėýthe Ėýpast Ėýtwenty-Ââfour Ėýmonths Ėýof Ėý8,000 Ėýsources Ėýof Ėýgifts, Ėý grants, Ėýand Ėýpartnership Ėýinitiatives Ėýprovided Ėýby Ėýcorporate, Ėýfamily, Ėýand Ėýrelated Ėýphilanthropic Ėýsources. Ėý Since Ėýmany Ėýfederal, Ėýstate, Ėýand Ėýlocal Ėýprograms Ėýrequiring Ėýmatching Ėýdollars Ėýor Ėýa Ėýnon-Ââprofit Ėýlead Ėýentity, Ėý tracking Ėýthese Ėýdollars Ėýassist Ėýin Ėýprojecting Ėýadditional Ėýimpacts Ėýon Ėýeconomic Ėýoutput Ėý Ėý Other ĖýOptions Ėýand ĖýData Ėý(additional Ėýcost) Ėý Ėý Partnerships Ėýhave Ėýbeen Ėýformed Ėýwith Ėýseveral Ėýother Ėýdata Ėýproviders Ėýincluding ĖýMonster.com Ėý(accessing Ėý their Ėýjob-Ââseekers Ėýaggregate Ėýinformation Ėýby Ėýregion, Ėýoccupation, Ėýsector), ĖýIPED Ėýdata Ėýprovided Ėýby ĖýUS Ėý Department Ėýof ĖýEducation Ėýon Ėýdegrees Ėýand Ėýcertificates, Ėýand Ėýthird Ėýparty Ėýproviders Ėýof Ėýinformation Ėýon Ėý social Ėýnetworks Ėýamong Ėýcivic-Ââbusiness-Ââacademic Ėýleadership. Ėý Ėý Research360 - Converting Data into Decisions 866.419.8509
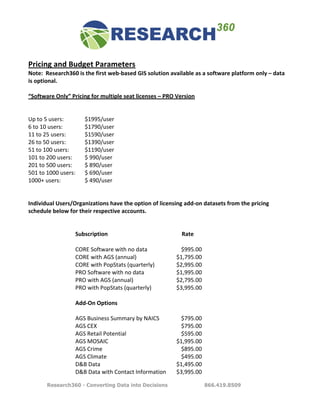
- 7. Ėý Pricing Ėýand ĖýBudget ĖýParameters Ėý Note: Ėý ĖýResearch360 Ėýis Ėýthe Ėýfirst Ėýweb-Ââbased ĖýGIS Ėýsolution Ėýavailable Ėýas Ėýa Ėýsoftware Ėýplatform Ėýonly Ėýâ Ėýdata Ėý is Ėýoptional. Ėý Ėý Ėý Ėý âSoftware ĖýOnlyâ ĖýPricing Ėýfor Ėýmultiple Ėýseat Ėýlicenses Ėýâ ĖýPRO ĖýVersion Ėý Ėý Ėý Up Ėýto Ėý5 Ėýusers: Ėý Ėý Ėý $1995/user Ėý Ėý 6 Ėýto Ėý10 Ėýusers: Ėý Ėý Ėý $1790/user Ėý 11 Ėýto Ėý25 Ėýusers: Ėý Ėý $1590/user Ėý 26 Ėýto Ėý50 Ėýusers: Ėý Ėý $1390/user Ėý 51 Ėýto Ėý100 Ėýusers: Ėý Ėý $1190/user Ėý 101 Ėýto Ėý200 Ėýusers: Ėý Ėý $ Ėý990/user Ėý 201 Ėýto Ėý500 Ėýusers: Ėý Ėý $ Ėý890/user Ėý 501 Ėýto Ėý1000 Ėýusers: Ėý Ėý $ Ėý690/user Ėý 1000+ Ėýusers: Ėý Ėý Ėý $ Ėý490/user Ėý Ėý Ėý Individual ĖýUsers/Organizations Ėýhave Ėýthe Ėýoption Ėýof Ėýlicensing Ėýadd-Ââon Ėýdatasets Ėýfrom Ėýthe Ėýpricing Ėý schedule Ėýbelow Ėýfor Ėýtheir Ėýrespective Ėýaccounts. Ėý Ėý Ėý Subscription Ėý Ėý Ėý Ėý Ėý Ėý ĖýRate Ėý Ėý Ėý CORE ĖýSoftware Ėýwith Ėýno Ėýdata Ėý $995.00 Ėý CORE Ėýwith ĖýAGS Ėý(annual) Ėý $1,795.00 Ėý CORE Ėýwith ĖýPopStats Ėý(quarterly) Ėý $2,995.00 Ėý PRO ĖýSoftware Ėýwith Ėýno Ėýdata Ėý $1,995.00 Ėý PRO Ėýwith ĖýAGS Ėý(annual) Ėý $2,795.00 Ėý PRO Ėýwith ĖýPopStats Ėý(quarterly) Ėý $3,995.00 Ėý Ėý Ėý Add-ÂâOn ĖýOptions Ėý Ėý Ėý Ėý AGS ĖýBusiness ĖýSummary Ėýby ĖýNAICS Ėý $795.00 Ėý AGS ĖýCEX Ėý $795.00 Ėý AGS ĖýRetail ĖýPotential Ėý $595.00 Ėý AGS ĖýMOSAIC Ėý $1,995.00 Ėý AGS ĖýCrime Ėý $895.00 Ėý AGS ĖýClimate Ėý $495.00 Ėý D&B ĖýData Ėý $1,495.00 Ėý D&B ĖýData Ėýwith ĖýContact ĖýInformation Ėý $3,995.00 Ėý Research360 - Converting Data into Decisions 866.419.8509
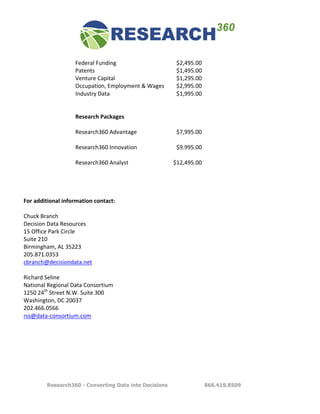
- 8. Ėý Ėý Federal ĖýFunding Ėý $2,495.00 Ėý Patents Ėý $1,495.00 Ėý Venture ĖýCapital Ėý $1,295.00 Ėý Occupation, ĖýEmployment Ėý& ĖýWages Ėý $2,995.00 Ėý Industry ĖýData Ėý $1,995.00 Ėý Ėý Ėý Research ĖýPackages Ėý Ėý Ėý Ėý Research360 ĖýAdvantage Ėý Ėý $7,995.00 Ėý Ėý Ėý Research360 ĖýInnovation Ėý Ėý $9.995.00 Ėý Ėý Ėý Research360 ĖýAnalyst Ėý Ėý $12,495.00 Ėý Ėý Ėý Ėý Ėý For Ėýadditional Ėýinformation Ėýcontact: Ėý Ėý Chuck ĖýBranch Ėý Decision ĖýData ĖýResources Ėý 15 ĖýOffice ĖýPark ĖýCircle Ėý Suite Ėý210 Ėý Birmingham, ĖýAL Ėý35223 Ėý 205.871.0353 Ėý cbranch@decisiondata.net Ėý Ėý Richard ĖýSeline Ėý National ĖýRegional ĖýData ĖýConsortium Ėý Ėý 1250 Ėý24th ĖýStreet ĖýN.W. ĖýSuite Ėý300 Ėý Washington, ĖýDC Ėý20037 Ėý 202.466.0566 Ėý rss@data-Ââconsortium.com Ėý Ėý Ėý Ėý Ėý Ėý Ėý Ėý Ėý Ėý Ėý Ėý Ėý Ėý Ėý Research360 - Converting Data into Decisions 866.419.8509