Reservoir pressure measurements 1
1 like2,177 views
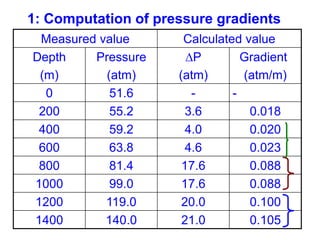
1) The document discusses methods for determining reservoir pressure gradients, depths of fluid interfaces like gas-oil and oil-water contacts, and pressures at various points from measured well data. 2) Equations are provided to calculate pressure gradients between two depths, depths of hydrocarbon interfaces using gradients above and below the interface, and pressures at perforations or contacts using the gradient and depth. 3) An example problem demonstrates calculating gradients, gas-oil contact depth, oil-water contact depth, and pressures at the contacts and perforations using a table of depth and pressure measurements.
1 of 15
Downloaded 36 times






Recommended
Reservoir rock & fluid


Reservoir rock & fluidNarendra Kumar Dewangan
╠²
This document discusses reservoir characteristics, rock and fluid properties, and drive mechanisms. It provides information on:
1) Techniques like seismic data, well logging, core analysis, and well testing that are used to understand the reservoir and develop an accurate reservoir model.
2) Reservoir characteristics including rock type, porosity, permeability, and factors that allow hydrocarbon accumulation like sufficient pore space and traps.
3) Rock properties such as porosity, permeability, and how they impact fluid flow.
4) Fluid properties including phase behavior under varying pressures and temperatures, properties of different fluid types, and sampling techniques.
5) Common experiments done to analyze reservoir fluids using pressure-volume-temperature cellsRock Compressibility


Rock CompressibilityM.T.H Group
╠²
Reservoir rocks experience compaction when fluid is produced, causing a change in pore volume and effective stress. There are three types of compressibility - rock matrix (grain) compressibility measures change in grain volume, rock bulk compressibility measures change in total formation volume, and pore volume compressibility measures change in pore space. Accurately measuring and modeling compressibility is important for predicting changes in porosity and formation properties during production.Production logging tools 


Production logging tools sajjadahmad809994
╠²
production engineering 2 topic.
which includes the production logging tools, its application, categories of application and also some uses of the log with example in the practical life and physics. Q921 re1 lec7 v1


Q921 re1 lec7 v1AFATous
╠²
This document outlines the key concepts in reservoir engineering. It discusses reservoir characteristics including fluid types, flow regimes, and geometries. It then covers steady-state and unsteady-state flow, defining transient flow as the period where the reservoir boundary has no effect. The document derives the diffusivity equation from continuity, transport, and compressibility equations. It discusses the assumptions and solutions of the diffusivity equation, including constant-terminal pressure and rate solutions.Measurement While Drilling (MWD)


Measurement While Drilling (MWD)Wade Bitaraf
╠²
The objective of this project is to investigate the measurement methods while drilling a well and perform a general assessment and comparison on the methods.
Well test analysis


Well test analysispetroleum engineer
╠²
This document discusses well testing and well test analysis software programs. It provides information on:
- The objectives of well testing including identifying fluid types and reservoir parameters
- Types of well tests including productivity tests for development wells and descriptive tests for exploration wells
- Popular well test software programs for analytical and numerical analysis including Saphir, PanSystem, Interpret 2000, and Weltest 200
- An overview of the Weltest 200 program which links analytical and numerical well test analysis through different modules
- Using an example of liquid productivity or IPR testing to demonstrate how well test data is incorporated and analyzed in the softwareBasic well log interpretation


Basic well log interpretationShahnawaz Mustafa
╠²
This document provides an overview of well log interpretation. It discusses how well logs are used to answer key questions about hydrocarbon-bearing formations like location, quantity, and producibility. The interpretation process involves identifying permeable zones using logs like SP and GR, then using resistivity and porosity logs to locate zones with hydrocarbons. Formations are further evaluated to determine porosity, fluid saturations, and other properties through techniques like density-neutron crossplots, environmental corrections, and determining formation temperature based on geothermal gradient. The goal is to locate potential producing zones and estimate hydrocarbon quantities and recoverability.Nodal Analysis introduction to inflow and outflow performance - next


Nodal Analysis introduction to inflow and outflow performance - nextgusgon
╠²
This document discusses nodal analysis concepts for analyzing inflow and outflow performance in fluid systems. It introduces key terms like nodal analysis, inflow, outflow, upstream and downstream components, and graphical solutions. It provides an example problem calculating system capacity and the impact of changing pipe diameters. It also covers topics like single-phase and multiphase fluid flow, flow regimes, flow patterns, and calculating pressure drops and flow performance in pipes.Density log


Density logZubair Kamboh
╠²
The document provides an overview of density logging, which measures rock bulk density along a wellbore. It defines density logging, describes the tool and principles behind it, and discusses how density logs can be used to evaluate porosity, lithology, shale compaction, and other geological features. Key applications include porosity calculation, lithology identification when combined with neutron logs, detecting unconformities from changes in shale compaction trends, and identifying lithologies like coal or pyrite from their characteristically low or high densities.Well stimulation - petroleum engineering


Well stimulation - petroleum engineeringRebaz Hamad
╠²
that is my presentation about well stimulation at Soran university in petroleum engineering department enjoy :)Drill stem test (mtm)


Drill stem test (mtm)majeed talal
╠²
A drill stem test (DST) is used to test characteristics of a newly drilled well while the drilling rig is still on site. It can provide estimates of permeability, reservoir pressure, fluid types, wellbore damage, barriers and fluid contacts. There are three main methods to analyze DST data: Horner's plot method, type curve matching method, and computer matching. Type curve matching involves matching pressure change over time data from the DST to standard type curves to determine properties like permeability and skin factor. Gringarten type curves are commonly used and account for variations in pressure over time based on reservoir-well configurations.Reservoir Simulation


Reservoir SimulationRigoberto Jos├® Mart├Łnez Cede├▒o
╠²
Overview of Reservoir Simulation by Prem Dayal Saini
Reservoir simulation is the study of how fluids flow in a hydrocarbon reservoir when put under production conditions. The purpose is usually to predict the behavior of a reservoir to different production scenarios, or to increase the understanding of its geological properties by comparing known behavior to a simulation using different geological representations.SP Log 


SP Log Zubair Kamboh
╠²
The document provides an overview of spontaneous potential (SP) logging. It discusses that SP logging measures natural electrical potentials between the borehole and surface. Positive deflections indicate fresher formation water than mud filtrate, while negative deflections mean saltier formation water. SP can be used to determine formation water resistivity and estimate shale volume. Key applications include detecting permeable zones, correlating formations, and determining facies.Reservoir Primary Recovery Mechanisms


Reservoir Primary Recovery Mechanismskusrick29
╠²
The document discusses various primary recovery mechanisms for oil and gas reservoirs. It describes the natural depletion drive mechanism where natural reservoir energy is used initially. Solution gas drive and gas cap drive are discussed where gas expansion provides the energy. Water drive mechanisms are also explained, where an aquifer provides the pressure to produce hydrocarbons. Different characteristics of depletion drive, gas cap drive, and water drive on pressure behavior, gas-oil ratio, water production and oil recovery percentages are compared. The document also briefly touches on gravity drainage drive and combination drive mechanisms.Resistivity log


Resistivity logAmir I. Abdelaziz
╠²
This document discusses resistivity logs and how they are used to analyze borehole formations. Resistivity is measured in ohms per meter and depends on factors like water volume, temperature, and salinity. Resistivity logs can determine hydrocarbon versus water-bearing zones and indicate permeable zones. The Archie equation relates resistivity to water saturation and uses constants determined by rock type. Different resistivity tools like electrode and induction logs measure resistivity at varying depths around the borehole to analyze fluid content and identify zones.Well Logging: 01 borehole environment


Well Logging: 01 borehole environmentkhaled Zidan
╠²
This document discusses concepts related to well logging. It covers topics like borehole environment, fluid distribution around wells, invasion ratios for different porosity rocks, flushed and uninvaded zones, depth of investigation, formation resistivity, invasion and resistivity profiles, and provides examples of dual laterolog and induction logs through water-bearing and hydrocarbon-bearing zones. The document contains definitions of important parameters and concepts used in well logging and provides explanations for calculating invasion diameters and interpreting well log curves.Neutron log


Neutron logZubair Kamboh
╠²
This presentation discusses neutron logs and their use in well log interpretation. Neutron logs measure the hydrogen index of formations using detectors that count slowed neutrons deflected back from hydrogen nuclei after being emitted from a radioactive source. They can be used both qualitatively to identify lithologies and quantitatively to calculate porosity. When combined with density logs on a cross-plot, the neutron-density combination is an effective tool for lithology indication and identifying clean formations, shales, and evaporites. Calibration is required using blocks of known porosity. Applications include porosity evaluation, identifying hydrocarbon gas effects, and accounting for shale effects.Estmation of oil & gas proven probable posiible


Estmation of oil & gas proven probable posiibleNarendra Kumar Dewangan
╠²
This document provides information on estimating oil and gas reserves. It defines various classifications of reserves from proven to unproven, and how reserves are estimated using volumetric, material balance, and production performance methods. The key classifications discussed are proven and probable reserves, with proven reserves having a 90% certainty of recovery and probable having 50% certainty. Volumetric estimation calculates initial hydrocarbon volumes using parameters like rock volume, porosity, fluid properties, and recovery factors.Hydrocarbon Phase Behaviour


Hydrocarbon Phase BehaviourM.T.H Group
╠²
This document discusses hydrocarbon phase behavior and provides several key points:
1. Hydrocarbons can exist in liquid, gas, and solid phases depending on pressure and temperature conditions. Phase changes occur as these conditions vary.
2. Understanding phase behavior is important for predicting subsurface fluid conditions and planning surface facilities as pressure and temperature change during production.
3. During production, liquid may condense from gas or gas may evolve from liquid as pressure and temperature decrease at the surface and within reservoirs.
4. Phase diagrams are used to represent phase relationships under various pressure and temperature conditions for pure components and mixtures.Repeated Formation Testers


Repeated Formation TestersOmar ElGanzoury
╠²
A detailed explanation for one of the most substantial tools in the wire-line formation testers family including the history of wire-line formation testers family, the main functions of the tool , the difference between RFT and DST , the operation of the tool , the pressure profiles , log presentation , log interpretation , corrections with other tools and permeability calculations from pressure measured by the RFT tool. Petroleum Production Engineering - Perforation


Petroleum Production Engineering - PerforationJames Craig
╠²
This document provides an overview of perforation for oil and gas wells. It discusses key objectives and components of perforation including shaped charges, explosives, perforating guns, and efficiency factors. It also covers well and reservoir characteristics relevant to perforation and provides equations for calculating perforation skin effects on well performance. The high-level goal of perforation is to establish communication between the wellbore and formation while maintaining reservoir inflow capacity.The reservoir (rock porosity and permeability)


The reservoir (rock porosity and permeability)salahudintanoli
╠²
Reservoir rock is the one of the important component in petroleum system i.e without it petroleum system is impossible. This presentation contain all necessary information regarding reservoir rock.Capillary Pressure


Capillary PressureHojjat Mahdiyar
╠²
1) Capillary pressure is defined as the curvature of the fluid interface times the surface tension. Higher curvature results in higher capillary pressure.
2) In smaller pores, the curvature of the fluid interface is higher, resulting in higher capillary pressure. As the saturation of the wetting phase decreases, the curvature increases in smaller pores and capillary pressure increases.
3) During drainage, the wetting phase is drawn into smaller pores, increasing capillary pressure. Drainage requires an entry pressure related to the largest pore diameter. Imbibition occurs spontaneously without an entry pressure as the wetting phase moves into smaller pores.Reservoir simulation (april 2017)


Reservoir simulation (april 2017)NghiaHuynh47
╠²
This document provides an overview and outline of a course on fundamentals of reservoir simulation. The course aims to review background on petroleum reservoir simulation and provide hands-on practice with Excel. The outline includes topics like flow equations for reservoirs, finite difference methods, single-phase and multiphase flow simulation. References are provided for additional reading.Well logging


Well loggingGeology Department, Faculty of Science, Tanta University
╠²
WELL LOG : Types of Logs, The Bore Hole Image, Interpreting Geophysical Well Logs, applications, Production logs, Well Log Classification and CatalogingPetrophysical Properties of Reservoir


Petrophysical Properties of ReservoirSYED NAWAZ
╠²
complete explanation of petrophysical properties of a reservoir
https://www.youtube.com/channel/UCRguLcGnzieKi5fgNGvfFGg?view_as=subscriber Introduction to Reservoir Rock & Fluid Properties


Introduction to Reservoir Rock & Fluid PropertiesM.T.H Group
╠²
This document discusses reservoir rock properties and how core samples are used to characterize reservoirs. Reservoir rocks must have porosity and permeability to store and transmit fluids. Core samples provide information on lithology, porosity, permeability and other properties essential for evaluating a reservoir's fluid storage and flow capabilities. Whole core samples are most representative but sidewall cores provide additional data points. Both core types are analyzed to understand factors like relative permeability needed for reservoir modeling and production forecasting.Petrophysic interpretation


Petrophysic interpretationAndi Anriansyah
╠²
1. The document discusses various well logging tools and concepts used in petrophysical interpretation. It describes tools such as the spontaneous potential (SP) log, gamma ray (GR) log, resistivity logs including induction and lateral logs, and porosity logs.
2. Key concepts covered include the logging environment and factors that impact tool measurements like borehole conditions and mud properties. Interpretation techniques for evaluating permeable zones, formation resistivity, water saturation, and porosity are also summarized.
3. The document provides examples of using tools and concepts like the Archie formula to calculate water resistivity, determine hydrocarbon presence, and evaluate clean versus shaly formations. It also discusses corrections that must be applied to well logSizing and selection information


Sizing and selection informationRommy Romanza
╠²
The document provides guidelines for selecting pumps, including:
1) Selection should be based on duty point, sizing data like pressure losses, pump materials, piping dimensions, shaft seal, inlet pressure and operating pressure.
2) Duty point can be used to select a pump based on curve charts. Sizing also considers required flow and pressure, pressure losses from height and friction, best efficiency point, and NPSH value.
3) Pumps should be selected to operate at or near the best efficiency point, considering the application's operating pattern. WinCAPS and WebCAPS programs can calculate efficiency.Step by-step compsressor Selection and sizing


Step by-step compsressor Selection and sizingtantoy13
╠²
This document provides guidelines for selecting and sizing compressors. It outlines 5 key steps: 1) Understand the application, 2) Find the details like gas type, pressures, temperatures and capacity, 3) Determine scope of supply, 4) Size the compressor, and 5) Select accessories. Further details are given for each step, including formulas and examples for determining inlet cubic feet per minute (ICFM) from other common capacity measurements like SCFM or lb/hr. The document uses a sample nitrogen gas compression problem to demonstrate working through each step of the sizing process.More Related Content
What's hot (20)
Density log


Density logZubair Kamboh
╠²
The document provides an overview of density logging, which measures rock bulk density along a wellbore. It defines density logging, describes the tool and principles behind it, and discusses how density logs can be used to evaluate porosity, lithology, shale compaction, and other geological features. Key applications include porosity calculation, lithology identification when combined with neutron logs, detecting unconformities from changes in shale compaction trends, and identifying lithologies like coal or pyrite from their characteristically low or high densities.Well stimulation - petroleum engineering


Well stimulation - petroleum engineeringRebaz Hamad
╠²
that is my presentation about well stimulation at Soran university in petroleum engineering department enjoy :)Drill stem test (mtm)


Drill stem test (mtm)majeed talal
╠²
A drill stem test (DST) is used to test characteristics of a newly drilled well while the drilling rig is still on site. It can provide estimates of permeability, reservoir pressure, fluid types, wellbore damage, barriers and fluid contacts. There are three main methods to analyze DST data: Horner's plot method, type curve matching method, and computer matching. Type curve matching involves matching pressure change over time data from the DST to standard type curves to determine properties like permeability and skin factor. Gringarten type curves are commonly used and account for variations in pressure over time based on reservoir-well configurations.Reservoir Simulation


Reservoir SimulationRigoberto Jos├® Mart├Łnez Cede├▒o
╠²
Overview of Reservoir Simulation by Prem Dayal Saini
Reservoir simulation is the study of how fluids flow in a hydrocarbon reservoir when put under production conditions. The purpose is usually to predict the behavior of a reservoir to different production scenarios, or to increase the understanding of its geological properties by comparing known behavior to a simulation using different geological representations.SP Log 


SP Log Zubair Kamboh
╠²
The document provides an overview of spontaneous potential (SP) logging. It discusses that SP logging measures natural electrical potentials between the borehole and surface. Positive deflections indicate fresher formation water than mud filtrate, while negative deflections mean saltier formation water. SP can be used to determine formation water resistivity and estimate shale volume. Key applications include detecting permeable zones, correlating formations, and determining facies.Reservoir Primary Recovery Mechanisms


Reservoir Primary Recovery Mechanismskusrick29
╠²
The document discusses various primary recovery mechanisms for oil and gas reservoirs. It describes the natural depletion drive mechanism where natural reservoir energy is used initially. Solution gas drive and gas cap drive are discussed where gas expansion provides the energy. Water drive mechanisms are also explained, where an aquifer provides the pressure to produce hydrocarbons. Different characteristics of depletion drive, gas cap drive, and water drive on pressure behavior, gas-oil ratio, water production and oil recovery percentages are compared. The document also briefly touches on gravity drainage drive and combination drive mechanisms.Resistivity log


Resistivity logAmir I. Abdelaziz
╠²
This document discusses resistivity logs and how they are used to analyze borehole formations. Resistivity is measured in ohms per meter and depends on factors like water volume, temperature, and salinity. Resistivity logs can determine hydrocarbon versus water-bearing zones and indicate permeable zones. The Archie equation relates resistivity to water saturation and uses constants determined by rock type. Different resistivity tools like electrode and induction logs measure resistivity at varying depths around the borehole to analyze fluid content and identify zones.Well Logging: 01 borehole environment


Well Logging: 01 borehole environmentkhaled Zidan
╠²
This document discusses concepts related to well logging. It covers topics like borehole environment, fluid distribution around wells, invasion ratios for different porosity rocks, flushed and uninvaded zones, depth of investigation, formation resistivity, invasion and resistivity profiles, and provides examples of dual laterolog and induction logs through water-bearing and hydrocarbon-bearing zones. The document contains definitions of important parameters and concepts used in well logging and provides explanations for calculating invasion diameters and interpreting well log curves.Neutron log


Neutron logZubair Kamboh
╠²
This presentation discusses neutron logs and their use in well log interpretation. Neutron logs measure the hydrogen index of formations using detectors that count slowed neutrons deflected back from hydrogen nuclei after being emitted from a radioactive source. They can be used both qualitatively to identify lithologies and quantitatively to calculate porosity. When combined with density logs on a cross-plot, the neutron-density combination is an effective tool for lithology indication and identifying clean formations, shales, and evaporites. Calibration is required using blocks of known porosity. Applications include porosity evaluation, identifying hydrocarbon gas effects, and accounting for shale effects.Estmation of oil & gas proven probable posiible


Estmation of oil & gas proven probable posiibleNarendra Kumar Dewangan
╠²
This document provides information on estimating oil and gas reserves. It defines various classifications of reserves from proven to unproven, and how reserves are estimated using volumetric, material balance, and production performance methods. The key classifications discussed are proven and probable reserves, with proven reserves having a 90% certainty of recovery and probable having 50% certainty. Volumetric estimation calculates initial hydrocarbon volumes using parameters like rock volume, porosity, fluid properties, and recovery factors.Hydrocarbon Phase Behaviour


Hydrocarbon Phase BehaviourM.T.H Group
╠²
This document discusses hydrocarbon phase behavior and provides several key points:
1. Hydrocarbons can exist in liquid, gas, and solid phases depending on pressure and temperature conditions. Phase changes occur as these conditions vary.
2. Understanding phase behavior is important for predicting subsurface fluid conditions and planning surface facilities as pressure and temperature change during production.
3. During production, liquid may condense from gas or gas may evolve from liquid as pressure and temperature decrease at the surface and within reservoirs.
4. Phase diagrams are used to represent phase relationships under various pressure and temperature conditions for pure components and mixtures.Repeated Formation Testers


Repeated Formation TestersOmar ElGanzoury
╠²
A detailed explanation for one of the most substantial tools in the wire-line formation testers family including the history of wire-line formation testers family, the main functions of the tool , the difference between RFT and DST , the operation of the tool , the pressure profiles , log presentation , log interpretation , corrections with other tools and permeability calculations from pressure measured by the RFT tool. Petroleum Production Engineering - Perforation


Petroleum Production Engineering - PerforationJames Craig
╠²
This document provides an overview of perforation for oil and gas wells. It discusses key objectives and components of perforation including shaped charges, explosives, perforating guns, and efficiency factors. It also covers well and reservoir characteristics relevant to perforation and provides equations for calculating perforation skin effects on well performance. The high-level goal of perforation is to establish communication between the wellbore and formation while maintaining reservoir inflow capacity.The reservoir (rock porosity and permeability)


The reservoir (rock porosity and permeability)salahudintanoli
╠²
Reservoir rock is the one of the important component in petroleum system i.e without it petroleum system is impossible. This presentation contain all necessary information regarding reservoir rock.Capillary Pressure


Capillary PressureHojjat Mahdiyar
╠²
1) Capillary pressure is defined as the curvature of the fluid interface times the surface tension. Higher curvature results in higher capillary pressure.
2) In smaller pores, the curvature of the fluid interface is higher, resulting in higher capillary pressure. As the saturation of the wetting phase decreases, the curvature increases in smaller pores and capillary pressure increases.
3) During drainage, the wetting phase is drawn into smaller pores, increasing capillary pressure. Drainage requires an entry pressure related to the largest pore diameter. Imbibition occurs spontaneously without an entry pressure as the wetting phase moves into smaller pores.Reservoir simulation (april 2017)


Reservoir simulation (april 2017)NghiaHuynh47
╠²
This document provides an overview and outline of a course on fundamentals of reservoir simulation. The course aims to review background on petroleum reservoir simulation and provide hands-on practice with Excel. The outline includes topics like flow equations for reservoirs, finite difference methods, single-phase and multiphase flow simulation. References are provided for additional reading.Well logging


Well loggingGeology Department, Faculty of Science, Tanta University
╠²
WELL LOG : Types of Logs, The Bore Hole Image, Interpreting Geophysical Well Logs, applications, Production logs, Well Log Classification and CatalogingPetrophysical Properties of Reservoir


Petrophysical Properties of ReservoirSYED NAWAZ
╠²
complete explanation of petrophysical properties of a reservoir
https://www.youtube.com/channel/UCRguLcGnzieKi5fgNGvfFGg?view_as=subscriber Introduction to Reservoir Rock & Fluid Properties


Introduction to Reservoir Rock & Fluid PropertiesM.T.H Group
╠²
This document discusses reservoir rock properties and how core samples are used to characterize reservoirs. Reservoir rocks must have porosity and permeability to store and transmit fluids. Core samples provide information on lithology, porosity, permeability and other properties essential for evaluating a reservoir's fluid storage and flow capabilities. Whole core samples are most representative but sidewall cores provide additional data points. Both core types are analyzed to understand factors like relative permeability needed for reservoir modeling and production forecasting.Petrophysic interpretation


Petrophysic interpretationAndi Anriansyah
╠²
1. The document discusses various well logging tools and concepts used in petrophysical interpretation. It describes tools such as the spontaneous potential (SP) log, gamma ray (GR) log, resistivity logs including induction and lateral logs, and porosity logs.
2. Key concepts covered include the logging environment and factors that impact tool measurements like borehole conditions and mud properties. Interpretation techniques for evaluating permeable zones, formation resistivity, water saturation, and porosity are also summarized.
3. The document provides examples of using tools and concepts like the Archie formula to calculate water resistivity, determine hydrocarbon presence, and evaluate clean versus shaly formations. It also discusses corrections that must be applied to well logSimilar to Reservoir pressure measurements 1 (20)
Sizing and selection information


Sizing and selection informationRommy Romanza
╠²
The document provides guidelines for selecting pumps, including:
1) Selection should be based on duty point, sizing data like pressure losses, pump materials, piping dimensions, shaft seal, inlet pressure and operating pressure.
2) Duty point can be used to select a pump based on curve charts. Sizing also considers required flow and pressure, pressure losses from height and friction, best efficiency point, and NPSH value.
3) Pumps should be selected to operate at or near the best efficiency point, considering the application's operating pattern. WinCAPS and WebCAPS programs can calculate efficiency.Step by-step compsressor Selection and sizing


Step by-step compsressor Selection and sizingtantoy13
╠²
This document provides guidelines for selecting and sizing compressors. It outlines 5 key steps: 1) Understand the application, 2) Find the details like gas type, pressures, temperatures and capacity, 3) Determine scope of supply, 4) Size the compressor, and 5) Select accessories. Further details are given for each step, including formulas and examples for determining inlet cubic feet per minute (ICFM) from other common capacity measurements like SCFM or lb/hr. The document uses a sample nitrogen gas compression problem to demonstrate working through each step of the sizing process.Unit7 nozzles


Unit7 nozzlesMalaysia
╠²
This document discusses nozzles and provides objectives and information about different types of nozzles. It defines nozzles and diffusers, describes convergent and convergent-divergent nozzle shapes. It also defines critical pressure ratio and maximum mass flow, and provides equations to calculate properties like area, temperature, and velocity at different points in a nozzle. An example calculation is provided to demonstrate determining the throat and exit areas of a convergent-divergent nozzle.fluid statics by Akshoy Ranjan Paul Mechanical engineering


fluid statics by Akshoy Ranjan Paul Mechanical engineeringakshitasingh916
╠²
fluid statics for 3rd semester
Pocket Guide to Chemical Engineering - CNTQ ( PDFDrive ).pdf


Pocket Guide to Chemical Engineering - CNTQ ( PDFDrive ).pdfKamilla Barcelos
╠²
This document provides an overview and summary of key concepts in fluid flow and piping design from the Pocket Guide to Chemical Engineering. It includes common equations for fluid flow, pressure drop, and velocity. Tables provide rules of thumb for pipe sizing and equivalent lengths of common fittings. Guidance is given for topics like compressible flow, partially full pipes, and two-phase flow. The document aims to equip engineers with quick design methods and equations that can be used in the field or when other references are not available.Basics cavitation


Basics cavitationH. Ganesan
╠²
Cavitation occurs when the liquid vaporizes as it enters the impeller of a pump if the inlet pressure is too low. The vapor bubbles collapse under increased pressure as they exit the impeller, releasing energy that erodes the impeller and bearings. Cavitation can be avoided by ensuring the net positive suction head available (NPSHA) is greater than the net positive suction head required (NPSHR) for a given pump. NPSHA depends on factors like elevation, pressure, friction losses, and temperature. An example calculation demonstrates how to determine if NPSHA exceeds NPSHR to prevent cavitation for a specific pump application.6._Bearing_Capacity_from_other_methods.pdf


6._Bearing_Capacity_from_other_methods.pdfAristotleMedina
╠²
This document discusses methods for estimating bearing capacity based on in-situ and laboratory tests. The most common in-situ tests are the Standard Penetration Test (SPT) and Cone Penetration Test (CPT). The SPT involves dropping a weight to penetrate a split spoon sampler and counting the number of blows, which is used to estimate bearing capacity based on empirical correlations. The CPT provides a continuous profile by measuring cone resistance, which can also be empirically correlated to bearing capacity. The document also discusses estimating bearing capacity from vane shear tests and plate load tests.Rehabilitation of pipeline between Banias-Homs


Rehabilitation of pipeline between Banias-Homsmohammed alzeer
╠²
This study evaluated the integrity and rehabilitation of an oil pipeline between Banias and Homs in Syria. Hydraulic calculations were performed to determine the maximum allowable operating pressure based on pipe specifications, fluid properties, and topography. Corrosion inspection results from 2008 identified over 100,000 features that were analyzed. Based on the extent of corrosion, the modified maximum allowable operating pressure was calculated to be 42 bar.Centrifugal pump design rev 2


Centrifugal pump design rev 2Junea June
╠²
The document provides details on the design process for a centrifugal pump given specific head, flow rate, and speed requirements provided by the client. Key steps include:
1) Calculating hydraulic parameters like flow rate, horsepower required, and shaft torque to size the shaft diameter.
2) Designing dimensions of the impeller like eye diameter, inlet and outlet angles, and widths to achieve the required flow while minimizing leakage losses.
3) Iteratively adjusting dimensions like impeller diameter until the calculated head matches the specified head within an acceptable tolerance.Pump


PumpAmir Razmi
╠²
This document defines various pump calculations and terms. It discusses total dynamic head, total suction head, total discharge head, static suction/discharge heads, velocity head, viscosity, friction head, pump work, water horsepower, pump efficiency, maximum discharge pressure, minimum flow, net positive suction head (NPSH), cavitation, affinity laws, specific speed, suction specific speed, and recommended dimensions for a sump pump intake structure. Equations are provided for calculating many of these terms.Turbomachinary: Axial flow compressor and fans


Turbomachinary: Axial flow compressor and fansVYAS INSTITUTE OF ENGG. & TECHNOLOGY
╠²
This power point presentation has for post graduate student in mechanical engineering in thermal engineering. This presentation is quite simple and perfect to explain the axial flow compressor and fan.It is the best presentation.Q922+de2+l05 v1


Q922+de2+l05 v1AFATous
╠²
This document discusses drilling hydraulics and optimization of drilling programs. It covers topics such as fluid flow models, calculating pressure drops, determining friction factors, and optimizing nozzle selection and hydraulic horsepower. The goal of optimization is to design hydraulic programs that provide maximum bottom hole cleaning and penetration rates given surface power availability. Key equations are presented to calculate pressure losses through drill pipes, annuli, surface equipment, nozzles, and friction factors for different flow regimes and fluid models.Q921 de2 lec5 v1


Q921 de2 lec5 v1AFATous
╠²
This document provides an overview of a drilling engineering course that covers topics such as drilling fluid hydraulics, flow patterns, pressure drops, and optimization of drilling programs. It discusses laminar and turbulent fluid flow, models for calculating pressure drops, friction factors, bit and surface equipment hydraulics. Methods for determining optimum pump rates, nozzle sizes, and hydraulic horsepower are presented. Cuttings transport models like Moore's and Chien's correlations are introduced to estimate minimum flow rates for effective hole cleaning. The goal of the course is to understand drilling fluid properties and optimize drilling programs for maximum penetration rates.Sample 


Sample Abd El-Aziz Mahmoud El-Abdy
╠²
This document provides specifications for a technical delivery of an item for Job NEM-LD-03 Drawing No. NEM-LD-03-01. It specifies that two caps are required as per the attached Material Requisition Report for size, tolerance, material, and other requirements. Testing reports and markings will be as required in the Material Requisition Report. Heat treatment and any supplementary requirements will also follow the specifications in the attached report.Well_Engineering_and_Construction_by_Hus.pdf


Well_Engineering_and_Construction_by_Hus.pdfAdlane3
╠²
This chapter discusses pore pressure fundamentals including definitions, causes of abnormal pore pressure, and methods of pore pressure evaluation. Key points discussed include:
1) Pore pressure is vital for well planning and is dependent on overburden pressure, formation properties, and depth. Accurate pore pressure predictions are needed for safe mud weight design, casing design, and drilling operations.
2) Abnormal pore pressures can be caused by undercompaction, gas hydrate decomposition, rapid sedimentation, and tectonic compression. Evaluation methods include LWD/MWD, repeat formation tests, and drill stem tests.
3) Overburden pressure is calculated based on bulk density, porosity, and fluid density usingsilo.tips_pete-203-drilling-engineering.ppt


silo.tips_pete-203-drilling-engineering.pptKOSIREDDYASHOKDEVAKU
╠²
This document discusses drilling hydraulics and fluid flow concepts. It covers topics like energy balance, flow through nozzles, hydraulic horsepower, conservation laws, average fluid velocity equations, the law of conservation of energy, determining pressure at different points, nozzle flow, hydraulic impact force, rheological fluid models including Newtonian, Bingham plastic and power-law models, laminar and turbulent flow, critical Reynolds number, pump pressure calculations, and pressure losses in different components like drill pipe, drill collars and bit nozzles. Diagrams illustrate concepts like velocity profiles, flow patterns and fraction factors. Equations are provided for calculations.P&w tables of compressible flow functions


P&w tables of compressible flow functionsJulio Banks
╠²
Compressible-flow Mach Functionas
Page 5 - Nomenclature
Pages 6 & 7 - Mach Functions
Recommendaitons: Used Equations on Pp. 6 & 7 to
generate any of the results from the table as functions
of specific heat ration, Gamma = Cp/Cv.
Enjoy it as one would enjoy their favorite music.01 pressure basic1


01 pressure basic1Khiem Vo Duy
╠²
This document provides an overview of pressure measurement fundamentals. It discusses why pressure is measured in industrial processes, defines what pressure is, and covers common pressure terminology. It also explains how non-pressure process variables like flow, level, density, and interface can be inferred from pressure measurements using concepts like continuity equations, Bernoulli's equation, and relationships between pressure and height of columns of liquid. Measurement technology and exercises are also mentioned.01 pressure-basic1


01 pressure-basic1ThŲ░ß╗¤ng ─Éß╗Ś Mß║Īnh
╠²
This document provides an overview of pressure measurement fundamentals. It discusses why pressure is measured in industrial processes, defines what pressure is, and reviews common pressure terminology. It also explains how non-pressure process variables like flow, level, density, and interface can be inferred from pressure measurements using principles like continuity equations, Bernoulli's equation, and relationships between pressure and height of columns of liquid. Measurement technology and exercises to reinforce the concepts are also covered at a high level.Recently uploaded (20)
ESIT135 Problem Solving Using Python Notes of Unit-1 and Unit-2


ESIT135 Problem Solving Using Python Notes of Unit-1 and Unit-2prasadmutkule1
╠²
ESIT135 Problem Solving Using Python Notes of Unit-1 and Unit-2AI ppt on water jug problem by shivam sharma


AI ppt on water jug problem by shivam sharmaShivamSharma588604
╠²
this ppt is made on the topic of water jug problem.GE 6B GT Ratcheting Animation- Hemananda Chinara.ppsx


GE 6B GT Ratcheting Animation- Hemananda Chinara.ppsxHemananda Chinara
╠²
GE 6B Gas Turbine Ratcheting Mechanism Animation made by Hemananda Chinara, SIC, CPP, HPL.The Golden Gate Bridge a structural marvel inspired by mother nature.pptx


The Golden Gate Bridge a structural marvel inspired by mother nature.pptxAkankshaRawat75
╠²
The Golden Gate Bridge is a 6 lane suspension bridge spans the Golden Gate Strait, connecting the city of San Francisco to Marin County, California.
It provides a vital transportation link between the Pacific Ocean and the San Francisco Bay.
Taykon-Kalite belgeleri


Taykon-Kalite belgeleriTAYKON
╠²
Kalite Politikam─▒z
Taykon ├ćelik i├¦in kalite, hayallerinizi bizlerle payla┼¤t─▒─¤─▒n─▒z an ba┼¤lar. Proje ├¦iziminden detaylar─▒n ├¦├Čz├╝m├╝ne, detaylar─▒n ├¦├Čz├╝m├╝nden ├╝retime, ├╝retimden montaja, montajdan teslime hayallerinizin ger├¦ekle┼¤ti─¤ini g├Črd├╝─¤├╝n├╝z ana kadar ge├¦en t├╝m a┼¤amalar─▒, ├¦al─▒┼¤anlar─▒, t├╝m teknik donan─▒m ve ├¦evreyi i├¦ine al─▒r KAL─░TE.IoT-based-Electrical-Motor-Fault-Detection-System.pptx


IoT-based-Electrical-Motor-Fault-Detection-System.pptxatharvapardeshi03
╠²
IoT-based-Electrical-Motor-Fault-Detection-System.pptxCloud Cost Optimization for GCP, AWS, Azure


Cloud Cost Optimization for GCP, AWS, Azurevinothsk19
╠²
Reduce Cloud Waste across AWS, GCP, Azure and Optimize Cloud Cost with a structured approach and improve your bottomline or profitability. Decide whether you want to outsource or manage it in house. Failover System in Cloud Computing System


Failover System in Cloud Computing SystemHitesh Mohapatra
╠²
Uses established clustering technologies for redundancy
Boosts availability and reliability of IT resources
Automatically transitions to standby instances when active resources become unavailable
Protects mission-critical software and reusable services from single points of failure
Can cover multiple geographical areas
Hosts redundant implementations of the same IT resource at each location
Relies on resource replication for monitoring defects and unavailability conditionsDesign and Analysis of Algorithms Unit 5


Design and Analysis of Algorithms Unit 5sureshkumara29
╠²
Algorithm design techniques include:
Brute Force
Greedy Algorithms
Divide-and-Conquer
Dynamic Programming
Reduction / Transform-and-Conquer
Backtracking and Branch-and-Bound
Randomization
Approximation
Recursive Approach
What is an algorithm?
An Algorithm is a procedure to solve a particular problem in a finite number of steps for a finite-sized input.
The algorithms can be classified in various ways. They are:
Implementation Method
Design Method
Design Approaches
Other Classifications
In this article, the different algorithms in each classification method are discussed.
The classification of algorithms is important for several reasons:
Organization: Algorithms can be very complex and by classifying them, it becomes easier to organize, understand, and compare different algorithms.
Problem Solving: Different problems require different algorithms, and by having a classification, it can help identify the best algorithm for a particular problem.
Performance Comparison: By classifying algorithms, it is possible to compare their performance in terms of time and space complexity, making it easier to choose the best algorithm for a particular use case.
Reusability: By classifying algorithms, it becomes easier to re-use existing algorithms for similar problems, thereby reducing development time and improving efficiency.
Research: Classifying algorithms is essential for research and development in computer science, as it helps to identify new algorithms and improve existing ones.
Overall, the classification of algorithms plays a crucial role in computer science and helps to improve the efficiency and effectiveness of solving problems.
Classification by Implementation Method: There are primarily three main categories into which an algorithm can be named in this type of classification. They are:
Recursion or Iteration: A recursive algorithm is an algorithm which calls itself again and again until a base condition is achieved whereas iterative algorithms use loops and/or data structures like stacks, queues to solve any problem. Every recursive solution can be implemented as an iterative solution and vice versa.
Example: The Tower of Hanoi is implemented in a recursive fashion while Stock Span problem is implemented iteratively.
Exact or Approximate: Algorithms that are capable of finding an optimal solution for any problem are known as the exact algorithm. For all those problems, where it is not possible to find the most optimized solution, an approximation algorithm is used. Approximate algorithms are the type of algorithms that find the result as an average outcome of sub outcomes to a problem.
Example: For NP-Hard Problems, approximation algorithms are used. Sorting algorithms are the exact algorithms.
Serial or Parallel or Distributed Algorithms: In serial algorithms, one instruction is executed at a time while parallel algorithms are those in which we divide the problem into subproblems and execute them on different processors. Data recovery and Digital evidence controls in digital frensics.pdf


Data recovery and Digital evidence controls in digital frensics.pdfAbhijit Bodhe
╠²
This topic contain information about Data recovery and Digital evidence controls in cyber and digital awarenessDefining the Future of Biophilic Design in Crete.pdf


Defining the Future of Biophilic Design in Crete.pdfARENCOS
╠²
Biophilic design is emerging as a key approach to enhancing well-being by integrating natural elements into residential architecture. In Crete, where the landscape is rich with breathtaking sea views, lush olive groves, and dramatic mountains, biophilic design principles can be seamlessly incorporated to create healthier, more harmonious living environments.
Designing Flex and Rigid-Flex PCBs to Prevent Failure


Designing Flex and Rigid-Flex PCBs to Prevent FailureEpec Engineered Technologies
╠²
Flex and rigid-flex printed circuit boards (PCBs) can be considered at the basic level some of the most complex PCBs in the industry. With that in mind, itŌĆÖs incredibly easy to make a mistake, to leave something out, or to create a design that was doomed from the start.
Such design failures can end up leading to an eventual failure by delamination, short circuits, damage to the flex portions, and many other things. The easiest way to circumvent these is to start at the beginning, to design with preventing failure in mind rather than trying to fix existing designs to accommodate for problems.
In this webinar, we cover how to design flex and rigid-flex PCBs with failure prevention in mind to save time, money, and headaches, and what failure can look like.
For more information on our flex and rigid-flex PCB solutions, visit https://www.epectec.com/flex.Von karman Equation full derivation .pdf


Von karman Equation full derivation .pdfEr. Gurmeet Singh
╠²
Von karman Equation full derivation
By Er. GURMEET SINGH
G.C.E.T JAMMU
Contact: gurmeet.b.tech@gmail.com
M.tech Transportation Engineering TASK-DECOMPOSITION BASED ANOMALY DETECTION OF MASSIVE AND HIGH-VOLATILITY SES...


TASK-DECOMPOSITION BASED ANOMALY DETECTION OF MASSIVE AND HIGH-VOLATILITY SES...samueljackson3773
╠²
The Science Information Network (SINET) is a Japanese academic backbone network for more than 800
universities and research institutions. The characteristic of SINET traffic is that it is enormous and highly
variableAI-Powered Power Converter Design Workflow.pdf


AI-Powered Power Converter Design Workflow.pdfAleksandr Terlo
╠²
Blending human expertise with AI-driven optimization for efficient power converter design.Reservoir pressure measurements 1
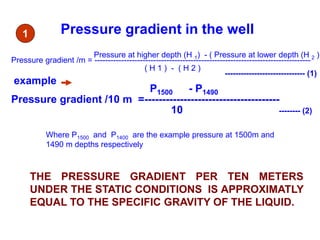
- 2. Pressure gradient in the well Pressure gradient /m = --------------------------------------------------------------------------------- Pressure at higher depth (H 1) - ( Pressure at lower depth (H 2 ) ( H 1 ) - ( H 2 ) ------------------------------ (1) Pressure gradient /10 m =-------------------------------------- P1500 - P1490 10 -------- (2) Where P1500 and P1400 are the example pressure at 1500m and 1490 m depths respectively THE PRESSURE GRADIENT PER TEN METERS UNDER THE STATIC CONDITIONS IS APPROXIMATLY EQUAL TO THE SPECIFIC GRAVITY OF THE LIQUID. example 1
- 3. Reduction of pressure at common datum ŌĆó The static pressures are reduced to common depth (datum). ŌĆó Usually it is mid of horizon or mid of oil column. (mid of top of oil bearing sand and OWC for oil reservoirs.) ŌĆó The relation may be given as: P1 = P2 + (H1 - H2 )x (pressure gradient/m) Where P1 and P2 are pressures in atmospheres at depths H1 and H2 ------------------------------ (3) 2
- 4. Depth of gas-oil ,oil water interface- GOC and OWC ŌĆó Gradient data provide a mean for selecting the intervals in which fluid column changes from gas to oil or from oil to water. ŌĆó Once the intervals are selected, depth of the hydrocarbon interface (Hc) can be calculated by using the following formula: Hc = H1 + ------------------------------------ (Pb - Pt) - Gdh ŌłåH Hc = Depth to interface, m H1 = Depth to top of interval, in which interval occurs, m Pb = pressure at bottom of interval, atm Pt = pressure at top of interval, atm Gdh = gradient of heavier fluid determined from upper interval, atm./m Gdl = gradient of lighter fluid determined from upper interval, atm./m ŌłåH = distance between points of measurement of Pt and Pb GdI - GdhWhere ------------------------------ (4) 3
- 5. Pressure at the perforations ŌĆó It is not possible to measure pressure at perforations. ŌĆó It can be reduced using following formula: Pp = Pb + ------------- ( Hp ŌĆō Hb ) Pp = pressure against the top of perforations, atm Pb = pressure at lowest depth of the survey, atm Pb-1 = pressure at the next lower depth of the survey, atm Hb = depth of the lowest measured pressure Pb , m Hp = depth of perforations, m Hb-1 = depth of Pb-1 ,m Pb - Pb-1 Hb - Hb-1 Where ------------------------------ (5) 4
- 6. Average gradient of the liquid column Depth of the base of liquid column Average gradient of the gas column Depth of the base of gas column Sub surface pressure Surface tubing or casing pressure Average Reservoir Pressure (approximation) ŌĆó Static Bottom hole pressure could not be determined for all the wells. ŌĆó Some wells representing whole of the reservoir are selected and static pressures are taken. ŌĆó These are reduced to common datum. ŌĆó Sub surface pressure can also be determined by approximation formula given as: = + x + x 5
- 7. ŌĆó Averaging method includes: (1)Well average pressure = (2)Areal average pressure= (3)Volumetric average pressure=--------- Average Reservoir Pressure pi n n 0 n 0 ╬Ż ----------- 0 0 0 ---------- ╬Ż ╬Ż ╬Ż pi Ai n Ai n n ╬Ż pi Aihi Aihi
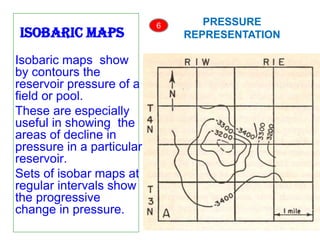
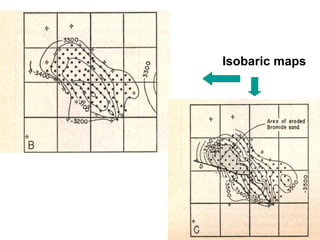
- 8. Isobaric maps Isobaric maps show by contours the reservoir pressure of a field or pool. These are especially useful in showing the areas of decline in pressure in a particular reservoir. Sets of isobar maps at regular intervals show the progressive change in pressure. 6 PRESSURE REPRESENTATION
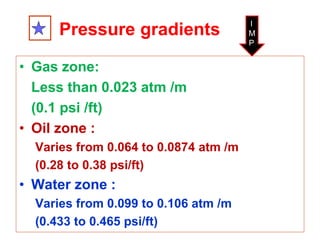
- 10. Pressure gradients ŌĆó Gas zone: Less than 0.023 atm /m (0.1 psi /ft) ŌĆó Oil zone : Varies from 0.064 to 0.0874 atm /m (0.28 to 0.38 psi/ft) ŌĆó Water zone : Varies from 0.099 to 0.106 atm /m (0.433 to 0.465 psi/ft) I M P
- 11. EXAMPLE The table given below may be used to compute: (a) Pressure gradients. (b) Depth of gas- oil and gas water inter face (c) Pressures at GOC and WOC Depth m 0 200 400 600 800 1000 1200 1400 Press. atm 51.6 55.2 59.2 63.8 81.4 99.0 119.0 140.0 GIVEN : Depths of top perforation : 1150 m GOC : 740 m WOC : 1170 m
- 12. Measured value Calculated value Depth (m) Pressure (atm) ŌłåP (atm) Gradient (atm/m) 0 51.6 - - 200 55.2 3.6 0.018 400 59.2 4.0 0.020 600 63.8 4.6 0.023 800 81.4 17.6 0.088 1000 99.0 17.6 0.088 1200 119.0 20.0 0.100 1400 140.0 21.0 0.105 1: Computation of pressure gradients
- 13. ŌĆó Depth of gas oil interface Refer ║▌║▌▀Ż 5 Hc = H1 + ------------------------------------ = 400 +-------------------------------- =400 +----------------------- =400 +200=600m (Pb - Pt) - Gdh ŌłåH 0.088 ŌĆō 0.023 ------------------------------ (4) (63.8- 59.2)-0.088x200 Gdl - Gdh (4.6 - 17.6) -0.065 Hc = Depth to interface, m H1 = Depth to top of interval, in which interval occurs, m Pb = pressure at bottom of interval, atm Pt = pressure at top of interval, atm Gdh = gradient of heavier fluid determined from upper interval, atm./m Gdl = gradient of lighter fluid determined from upper interval, atm./m ŌłåH + distance between points of measurement of Pt and Pb Where
- 14. Refer ║▌║▌▀Ż 5 (99.0- 81.4)- 0.105x200 0.088 ŌĆō 0.105 (17.6 - 21.0) ŌĆō 0.17 ŌĆó Depth of oil-water interface Hc = 800 + ------------------------------------ = 800 +--------------------------- = 800 +200=1000m
- 15. Pressure of the top of perforation can also be determined using equation 1 Pp = 99 +0.088(1150 ŌĆō 1000)=99+0.088 x 150 =99+13.2=112.2 ŌĆó Pressure at GOC: PGOC=112 .2 + 0.088 (740 -1150) = 112.2 + 0.088(-410)=112.2-36.8 =76.12 atm ŌĆó Pressure at WOC: PWOC=112 .2 + 0.088 (1170 -1150) = 112.2 + 0.088(20)=112.2+1.76 =113.96atm


