際際滷

際際滷Share a Scribd company logo
CBRE GLOBAL RESEARCH
This report was prepared by the CBRE Asia Pacific Research Team, which forms part of CBRE Global Research  a network of preeminent researchers who collaborate to provide real estate market research and econometric forecasting to real estate.
息 CBRE Ltd. 2015 Information contained herein, including projections, has been obtained from sources believed to be reliable. While we do not doubt its accuracy, we have not verified it and make no guarantee, warranty or representation about it. It is your
responsibility to confirm independently its accuracy and completeness. This information is presented exclusively for use by CBRE clients and professionals and all rights to the material are reserved and cannot be reproduced without prior written permission of CBRE.
11
TOKYO SINGAPORE
2
58ENTRIES
2
KUALA
LUMPUR
=8
44
HONGKONG BEIJING
5
34ENTRIES
5
SHANGHAI
7
SHENZHEN
11
MELBOURNE
12
SYDNEY
13
MUMBAI
=14
MANILA
6
=8
BANGKOK NEW
DELHI
=8
TAIPEI
3
49ENTRIES
3
BRISBANE
=14
63ENTRIES 58ENTRIES 19ENTRIES45ENTRIES 34ENTRIES 20ENTRIES 14ENTRIES 13ENTRIES 12ENTRIES 11ENTRIES24ENTRIES 19ENTRIES 19ENTRIES49ENTRIES 11ENTRIES63ENTRIES 58ENTRIES 19ENTRIES45ENTRIES 34ENTRIES 20ENTRIES 14ENTRIES 13ENTRIES 12ENTRIES 11ENTRIES24ENTRIES 19ENTRIES 19ENTRIES49ENTRIES 11ENTRIES
2014
464Entries
2013
378 Entries
Luxury and Business
22.6%
Homeware and
Department
Stores
6.3%
Value and
Denim
6.3%
Other
11.0%
Consumer
Electronics
0.6%
Supermarket
0.2%
Coffee and
Restaurants
22.4%
Mid Range
Fashion
15.7%
Specialist
Clothing
14.9%
UNITED
STATES
24%
RANK#
1
2014 24%
UNITED
STATES
11%
ITALY
11%
UNITED
KINGDOM
10.5%
FRANCE
6.9%
JAPAN
RETAIL HOTSPOTS IN ASIA PACIFIC 2014
RETAILERS
COUNTRY
OF ORIGIN
MOST ACTIVE
RETAIL SECTOR
F&B displayed the strongest growth.
TOP TARGET MARKETS
Gateway cities in Asia continued to be the main
focus whilst Australia saw an increase in activity.
CROSS-BORDER
RETAIL ACTIVITY

More Related Content

Retail Hotspots in Asia Pacific 2014

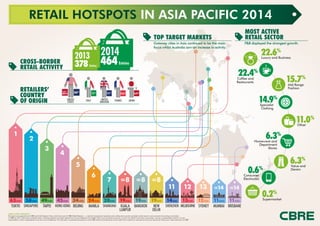
  • 1. CBRE GLOBAL RESEARCH This report was prepared by the CBRE Asia Pacific Research Team, which forms part of CBRE Global Research a network of preeminent researchers who collaborate to provide real estate market research and econometric forecasting to real estate. 息 CBRE Ltd. 2015 Information contained herein, including projections, has been obtained from sources believed to be reliable. While we do not doubt its accuracy, we have not verified it and make no guarantee, warranty or representation about it. It is your responsibility to confirm independently its accuracy and completeness. This information is presented exclusively for use by CBRE clients and professionals and all rights to the material are reserved and cannot be reproduced without prior written permission of CBRE. 11 TOKYO SINGAPORE 2 58ENTRIES 2 KUALA LUMPUR =8 44 HONGKONG BEIJING 5 34ENTRIES 5 SHANGHAI 7 SHENZHEN 11 MELBOURNE 12 SYDNEY 13 MUMBAI =14 MANILA 6 =8 BANGKOK NEW DELHI =8 TAIPEI 3 49ENTRIES 3 BRISBANE =14 63ENTRIES 58ENTRIES 19ENTRIES45ENTRIES 34ENTRIES 20ENTRIES 14ENTRIES 13ENTRIES 12ENTRIES 11ENTRIES24ENTRIES 19ENTRIES 19ENTRIES49ENTRIES 11ENTRIES63ENTRIES 58ENTRIES 19ENTRIES45ENTRIES 34ENTRIES 20ENTRIES 14ENTRIES 13ENTRIES 12ENTRIES 11ENTRIES24ENTRIES 19ENTRIES 19ENTRIES49ENTRIES 11ENTRIES 2014 464Entries 2013 378 Entries Luxury and Business 22.6% Homeware and Department Stores 6.3% Value and Denim 6.3% Other 11.0% Consumer Electronics 0.6% Supermarket 0.2% Coffee and Restaurants 22.4% Mid Range Fashion 15.7% Specialist Clothing 14.9% UNITED STATES 24% RANK# 1 2014 24% UNITED STATES 11% ITALY 11% UNITED KINGDOM 10.5% FRANCE 6.9% JAPAN RETAIL HOTSPOTS IN ASIA PACIFIC 2014 RETAILERS COUNTRY OF ORIGIN MOST ACTIVE RETAIL SECTOR F&B displayed the strongest growth. TOP TARGET MARKETS Gateway cities in Asia continued to be the main focus whilst Australia saw an increase in activity. CROSS-BORDER RETAIL ACTIVITY