Risk returns analysis
- 4. RISK-RETURN NEXUS: EMPIRICAL EVIDENCE FROM THE CAPM
- 5. Title and Content Layout with List ï§ Concept of Risk ï§ Concept of Return ï§ Financial Decision ï§ Risk Portfolio Diversification and Indifference Curve
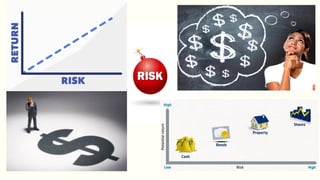
- 6. What is risk? ï§Risk is the potential for divergence between the actual outcome and what is expected. ï§In finance, risk is usually related to whether expected cash flows will materialize, whether security prices will fluctuate unexpectedly, or whether returns will be as expected. ï§Risk is a measure of the uncertainty surrounding the return that an investment will earn or, more formally, the variability of returns associated with a given asset.
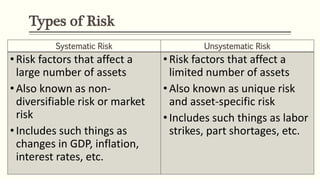
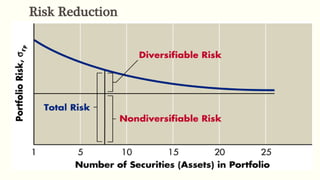
- 7. Types of Risk Systematic Risk Unsystematic Risk âĒRisk factors that affect a large number of assets âĒAlso known as non- diversifiable risk or market risk âĒIncludes such things as changes in GDP, inflation, interest rates, etc. âĒRisk factors that affect a limited number of assets âĒAlso known as unique risk and asset-specific risk âĒIncludes such things as labor strikes, part shortages, etc.
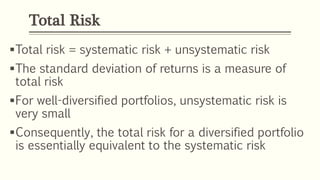
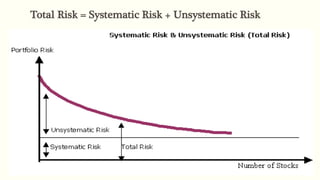
- 8. Total Risk ï§Total risk = systematic risk + unsystematic risk ï§The standard deviation of returns is a measure of total risk ï§For well-diversified portfolios, unsystematic risk is very small ï§Consequently, the total risk for a diversified portfolio is essentially equivalent to the systematic risk
- 9. Total Risk = Systematic Risk + Unsystematic Risk
- 10. Systematic Risk Principle ï§There is a reward for bearing risk ï§There is not a reward for bearing risk unnecessarily ï§The expected return on a risky asset depends only on that assetâs systematic risk since unsystematic risk can be diversified away
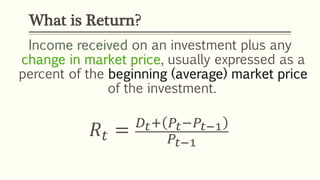
- 11. Income received on an investment plus any change in market price, usually expressed as a percent of the beginning (average) market price of the investment. ð ðĄ = ð·ðĄ+ ððĄâððĄâ1 ððĄâ1 What is Return?
- 12. Returns ï§Total Return = expected return + unexpected return ï§Unexpected return = systematic portion + unsystematic portion ï§Therefore, total return can be expressed as follows: ï§Total Return = expected return + systematic portion + unsystematic portion
- 13. The risk premium ï§The risk premium is the return on a risky security minus the return on a risk-free security (often T-bills are used as the risk-free security) ï§Another name for a securityâs risk premium is the excess return of the risky security. ï§The market risk premium is the return on the market (as a whole) minus the risk-free rate of return. ï§We may talk about this much later in this study.
- 14. Keynote Thus, effective risk pooling strategy that will guarantee optimal returns associated with uncorrelated risk portfolios. That is, a diversified risk portfolio commands higher risk-returns tradeoff mix. This may also warrant the need for risk sharing (the spreading of risk between insurers according to percentage retention capacity). On the whole, risk pooling and sharing in insurance allows individuals underwriters to deal many risks at affordable premiums.
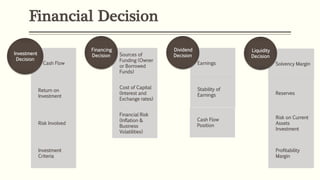
- 16. Financial Decision and Risk Portfolio Diversification Financial Decisions is a comprehensive financial planning and wealth management firm that helps high-net-worth individuals and businesses achieve their financial objectives. Types of Financial Decisions 1. Investment decision (Capital Budgeting Decision) 2. Financing decision (Sources of Funding Decision) 3. Dividend decision 4. Liquidity Decision
- 17. Financial Decision Cash Flow Return on Investment Risk Involved Investment Criteria Investment Decision Sources of Funding (Owner or Borrowed Funds) Cost of Capital (Interest and Exchange rates) Financial Risk (Inflation & Business Volatilities) Financing Decision Earnings Stability of Earnings Cash Flow Position Dividend Decision Solvency Margin Reserves Risk on Current Assets Investment Profitability Margin Liquidity Decision
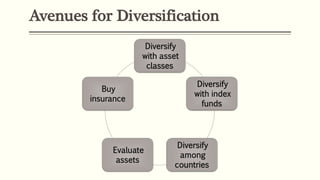
- 18. Avenues for Diversification Diversify with asset classes Diversify with index funds Diversify among countries Evaluate assets Buy insurance
- 19. Risk Portfolio Diversification and Indifference Curve In economics, the analysis of consumer behavior is performed using the indifference curve approach. The indifference curve shows consumption bundles that give the consumer the same level of satisfaction. That is, the risk appetite of an insurer on risk portfolios that guarantees the highest risk premium in insurance.
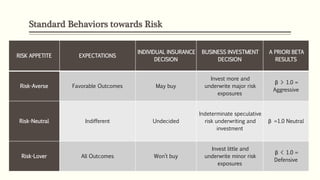
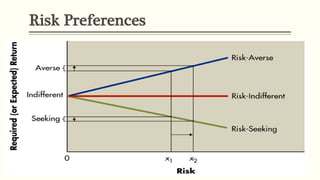
- 20. Standard Behaviors towards Risk RISK APPETITE EXPECTATIONS INDIVIDUAL INSURANCE DECISION BUSINESS INVESTMENT DECISION A PRIORI BETA RESULTS Risk-Averse Favorable Outcomes May buy Invest more and underwrite major risk exposures Îē > 1.0 = Aggressive Risk-Neutral Indifferent Undecided Indeterminate speculative risk underwriting and investment Îē =1.0 Neutral Risk-Lover All Outcomes Wonât buy Invest little and underwrite minor risk exposures Îē < 1.0 = Defensive
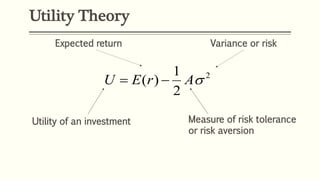
- 21. Utility Theory 2 2 1 )( ïģArEU ïï― Utility of an investment Expected return Variance or risk Measure of risk tolerance or risk aversion
- 22. Risk Preferences
- 23. Risk Reduction
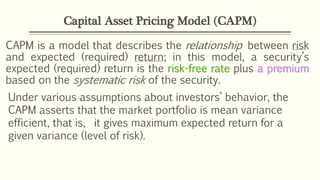
- 25. CAPM is a model that describes the relationship between risk and expected (required) return; in this model, a securityâs expected (required) return is the risk-free rate plus a premium based on the systematic risk of the security. Capital Asset Pricing Model (CAPM) Under various assumptions about investorsâ behavior, the CAPM asserts that the market portfolio is mean variance efficient, that is, it gives maximum expected return for a given variance (level of risk).
- 26. The Capital Asset Pricing Model (CAPM) ïąCapital Asset Pricing Model or the CAPM provides a relatively simple measure of risk. ïąCAPM assumes that investors choose to hold the optimally diversified portfolio that includes all risky investments. This optimally diversified portfolio that includes all of the economyâs assets is referred to as the market portfolio. ïąAccording to the CAPM, the relevant risk of an investment relates to how the investment contributes to the risk of this market portfolio. 26
- 27. The Capital Asset Pricing Model (CAPM) ï§The capital asset pricing model defines the relationship between risk and return ï§If we know an assetâs systematic risk, we can use the CAPM to determine its expected return ï§This is true whether we are talking about financial assets or physical assets
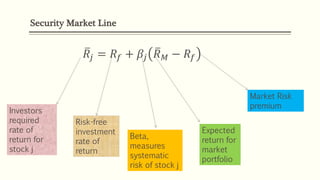
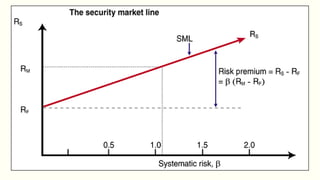
- 28. Security Market Line ð ð = ð ð + ð―ð ð ð â ð ð Investors required rate of return for stock j Risk-free investment rate of return Beta, measures systematic risk of stock j Expected return for market portfolio Market Risk premium
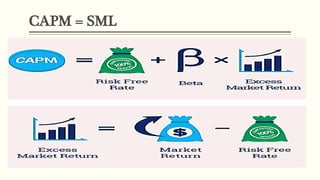
- 29. CAPM = SML
- 30. Security Market Line cont.
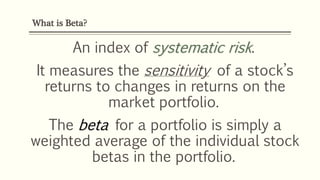
- 32. An index of systematic risk. It measures the sensitivity of a stockâs returns to changes in returns on the market portfolio. The beta for a portfolio is simply a weighted average of the individual stock betas in the portfolio. What is Beta?
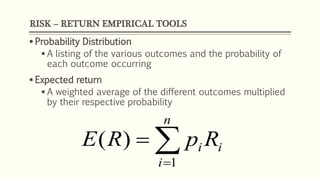
- 33. RISK â RETURN EMPIRICAL TOOLS ï§ Probability Distribution ï§ A listing of the various outcomes and the probability of each outcome occurring ï§ Expected return ï§ A weighted average of the different outcomes multiplied by their respective probability ïĨï― ï― n i ii RpRE 1 )(
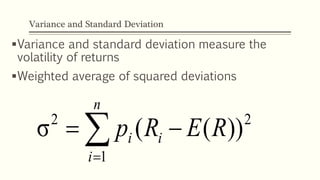
- 34. Variance and Standard Deviation ï§Variance and standard deviation measure the volatility of returns ï§Weighted average of squared deviations ïĨï― ïï― n i ii RERp 1 22 ))((Ï
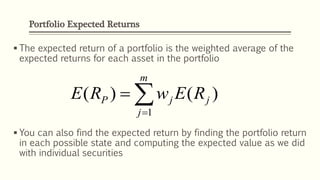
- 35. Portfolio Expected Returns ï§ The expected return of a portfolio is the weighted average of the expected returns for each asset in the portfolio ï§ You can also find the expected return by finding the portfolio return in each possible state and computing the expected value as we did with individual securities ïĨï― ï― m j jjP REwRE 1 )()(
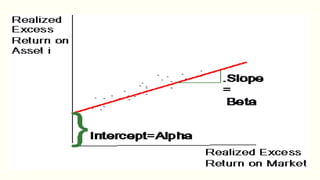
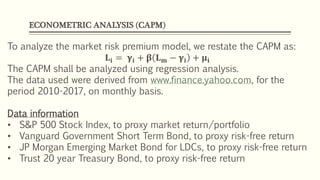
- 36. ECONOMETRIC ANALYSIS (CAPM) To analyze the market risk premium model, we restate the CAPM as: ððĒ = ððĒ + ð ð ðĶ â ððĒ + ððĒ The CAPM shall be analyzed using regression analysis. The data used were derived from www.finance.yahoo.com, for the period 2010-2017, on monthly basis. Data information âĒ S&P 500 Stock Index, to proxy market return/portfolio âĒ Vanguard Government Short Term Bond, to proxy risk-free return âĒ JP Morgan Emerging Market Bond for LDCs, to proxy risk-free return âĒ Trust 20 year Treasury Bond, to proxy risk-free return
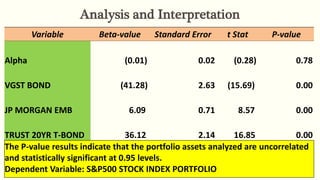
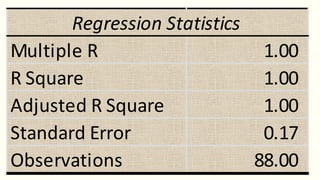
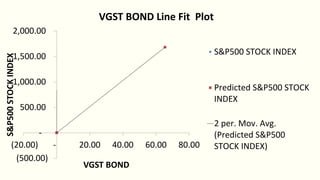
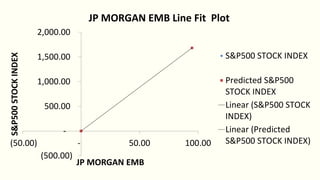
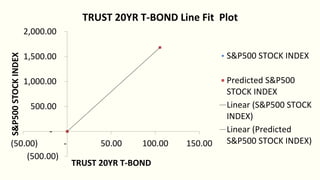
- 37. Analysis and Interpretation Variable Beta-value Standard Error t Stat P-value Alpha (0.01) 0.02 (0.28) 0.78 VGST BOND (41.28) 2.63 (15.69) 0.00 JP MORGAN EMB 6.09 0.71 8.57 0.00 TRUST 20YR T-BOND 36.12 2.14 16.85 0.00 The P-value results indicate that the portfolio assets analyzed are uncorrelated and statistically significant at 0.95 levels. Dependent Variable: S&P500 STOCK INDEX PORTFOLIO
- 38. Multiple R 1.00 R Square 1.00 Adjusted R Square 1.00 Standard Error 0.17 Observations 88.00 Regression Statistics
- 39. (500.00) - 500.00 1,000.00 1,500.00 2,000.00 (20.00) - 20.00 40.00 60.00 80.00 S&P500STOCKINDEX VGST BOND VGST BOND Line Fit Plot S&P500 STOCK INDEX Predicted S&P500 STOCK INDEX 2 per. Mov. Avg. (Predicted S&P500 STOCK INDEX)
- 40. (500.00) - 500.00 1,000.00 1,500.00 2,000.00 (50.00) - 50.00 100.00 S&P500STOCKINDEX JP MORGAN EMB JP MORGAN EMB Line Fit Plot S&P500 STOCK INDEX Predicted S&P500 STOCK INDEX Linear (S&P500 STOCK INDEX) Linear (Predicted S&P500 STOCK INDEX)
- 41. (500.00) - 500.00 1,000.00 1,500.00 2,000.00 (50.00) - 50.00 100.00 150.00 S&P500STOCKINDEX TRUST 20YR T-BOND TRUST 20YR T-BOND Line Fit Plot S&P500 STOCK INDEX Predicted S&P500 STOCK INDEX Linear (S&P500 STOCK INDEX) Linear (Predicted S&P500 STOCK INDEX)
- 42. BRAVO!


