Roassal presentation
- 1. Roassal turn your programming environment into a beauty center for objects Vanessa PeÃąa Camilo Gomez Alexandre Bergel Object ProïŽle & University of Chile
- 2. Roassal Advanced visualization engine Useful to draw pictures of your data Well modularized Easily portable (Pharo, VisualWorks, Amber, ...) Few external dependencies Open source (MIT)
- 4. view nodes: Collection withAllSubclasses.
- 5. view nodes: Collection withAllSubclasses.
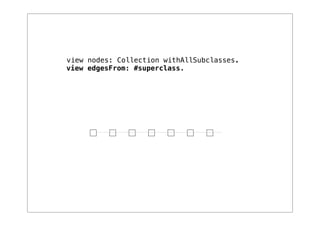
- 6. view nodes: Collection withAllSubclasses. view edgesFrom: #superclass.
- 7. view nodes: Collection withAllSubclasses. view edgesFrom: #superclass. view treeLayout
- 8. view shape rectangle ! width: #numberOfVariables; ! height: #numberOfMethods. view nodes: Collection withAllSubclasses. view edgesFrom: #superclass. view treeLayout DEMO
- 9. Roassal architecture & model Your application shape1 shape2 shape3 Mondrian Graphical Roassal Element Pharo, VW, interaction Amber dictionary
- 10. ProïŽling blueprint A B E gray = C execution side effect time yellow = no side effect D #executions 1 3 2 Method 1 calls Method 2. Method 3 calls Method 1 F 10
- 11. ProïŽling blueprint A B E gray = C execution side effect methods that takes times, time yellow = no side effect are executed many times, #executions D and without signiïŽcant 1 side effect 3Method 1 calls Method 2. 2 Method 3 calls Method 1 F 11
- 12. Adding a memoization ROElement>>bounds ! "Return the bounds of the element" ! boundsCache ifNotNil: [ ^ boundsCache ]. ! ^ boundsCache := self position extent: (shape extentFor: self)
- 13. Adding a memoization ROElement>>bounds ! "Return the bounds of the element" ! boundsCache ifNotNil: [ ^ boundsCache ]. ! ^ boundsCache := self position extent: (shape extentFor: self)
- 14. Effect of the memoization 14
- 15. make display:on: absoluteBounds call absoluteBounds instead of absoluteBoundsFor A' C' B' C' 15
- 16. Execution proïŽling blueprints. So!ware: Practices and Experience, 2012 Visualizing Dynamic Metrics with ProïŽling Blueprints. Proceedings of the TOOLS, 2010 Counting Messages as a Proxy for Average Execution Time in Pharo. Proceedings of ECOOP, 2011 Identifying Optimization Opportunities by Visualizing So!ware Execution. To be submitted to CACM 16
- 17. 17
- 18. VisuAule Visual code inspector By Camilo during the âshow us your projectâ session 18
- 19. Join us! We have positions Interships Engineering Master PhD Deadline is the end of this month Santiago is a cool city! no mosquitos!
- 20. °ŋēúÂáąðģĶģŲąĘ°ųīĮïŽląð.ģĶīĮģū facebook.com/ObjectProïŽle @ObjectProïŽle Spy @ Cincom Store Spy @ SqueakSource Spy @ ... Thanks to all of you guys!


![Adding a memoization
ROElement>>bounds
! "Return the bounds of the element"
! boundsCache ifNotNil: [ ^ boundsCache ].
! ^ boundsCache :=
self position extent: (shape extentFor: self)](https://image.slidesharecdn.com/2012-roassalsmalltalks-121108151436-phpapp02/85/Roassal-presentation-12-320.jpg)
![Adding a memoization
ROElement>>bounds
! "Return the bounds of the element"
! boundsCache ifNotNil: [ ^ boundsCache ].
! ^ boundsCache :=
self position extent: (shape extentFor: self)](https://image.slidesharecdn.com/2012-roassalsmalltalks-121108151436-phpapp02/85/Roassal-presentation-13-320.jpg)


