ºÝºÝߣ

ºÝºÝߣShare a Scribd company logo
Motivation: researchers often obtain copious and/or incomplete data that
can be superfluous/collinear in terms of explaining particular outcomes—
even sophisticated analysis software and technology struggle under
these particular conditions.
Purpose: compare Principal Component Analysis (PCA), Partial Least
Squares (PLS), and Johnson-Lindenstrauss inspired Random Matrices
(RMs) in terms of reducing dataset dimensionality while retaining
practical generality by reducing bias and mean-squared error (MSE).
Survival Analysis: overcomes limitations of standard regression
approaches; able to include positive values; can handle censoring.
Accelerated Failure Time (AFT) Model: provides intuitive interpretation of
predictor and response variables via survivor curves; directly models
survival times.
PCA: obtains components/eigenvalues from data’s variance-covariance
matrix; maximizes covariance and correlation of linear combinations of
predictor variable; produces new less correlated variables by
constructing orthogonal transformations of covariates.
PLS: similar to PCA; however, PLS maximizes covariance and
correlation of linear combinations of predictor and response variables;
projects predictor and response variables into new space to model
covariance structure.
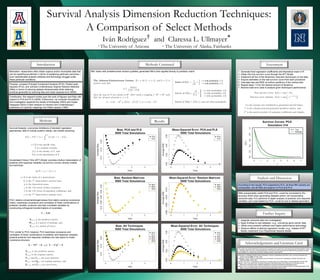
According to the results, PCA outperforms PLS, all three RM variants are
comparable, and all RMs are superior to PCA and PLS.
1. Integrate censored data into investigation.
2. Apply findings to real datasets—e.g., microarray gene cancer data.
3. Utilize more powerful software and higher-performance technology.
4. Observe effects of altering regression model—e.g., instead of AFT
Model, implement Cox Proportional Hazards Model.
Achlioptas, D. Database-friendly random projections: Johnson-Lindenstrauss with binary coins. Journal of Computer and
System Sciences 66(4): 671-687, 2003.
Dasgupta, S. and A. Gupta. An elementary proof of a theorem of Johnson and Lindenstrauss. Random Structures and
Algorithms 22(1): 60-65, 2003.
Johnson, W.B. and J. Lindenstrauss. Extensions of Lipschitz maps into a Hilbert space. Contemp Math 26: 189-206,1984.
Nguyen, Tuan S. and Javier Rojo. Dimension Reduction of Microarray Data in the Presence of a Censored Survival
Response: A Simulation Study. Statistical Applications in Genetics and Molecular Biology 8(1): 2009.
Nguyen, Tuan S. and Javier Rojo. Dimension Reduction of Microarray Gene Expression Data: The Accelerated Failure Time
Model. Journal of Bioinformatics and Computational Biology 7(6): 939-954, 2009.
This project was ameliorated thanks to the generous guidance and support from Javier Rojo along with Kyle Bradford, Nathan
C. Wiseman, Raul Cruz-Cano, and Rashidul Hasan. This research was supported by the National Security Agency through
Grant H98230-15-1-0048 to the University of Nevada at Reno, Javier Rojo PI.
Analysis and Discussion
RMs unexpectedly outdid PCA and PLS—could be connected to R’s
accuracy limits when generating datasets and/or not incorporating
censored data; PLS performs in-depth analysis of predictor and response
variables, yet it was bested by PCA—could be due to dataset generation.
Further Inquiry
Acknowledgements and Literature Cited
Results
Assessment
Sample Curve
Introduction
Methods
Contribution: this research builds upon the work of Nguyen and Rojo with
respect to PCA and PLS (2009); furthermore, via computer simulations,
this investigation appends the results of Achlioptas (2003) and Gupta-
Dasgupta (2003) in their analysis of Johnson and Lindenstrauss’s
extensions of Lipschitz mappings into Hilbert spaces (1984).
Methods Continued
RM: matrix with predetermined random qualities; generated RM is then applied directly to predictor matrix. 1. Generate fixed regression coefficients and theoretical mean in R.
2. Obtain the true survivor curve through the AFT Model.
3. Implement all five of the dimension reduction techniques on the data.
4. Acquire estimates on the real survivor curve from each procedure.
5. Calculate bias and MSE at uniform partitions of the vertical axis.
6. Repeat steps 1-5 for the desired amount of iterations.
7. Receive total error plots to analyze given technique’s performance.
Survival Analysis Dimension Reduction Techniques:
A Comparison of Select Methods
Iván Rodríguez†
and Claressa L. Ullmayer∗
† The University of Arizona * The University of Alaska, Fairbanks
More Related Content

Rodriguez_Ullmayer_Rojo_RUSIS@UNR_REU_Poster_Presentation_JMM

  • 1. Motivation: researchers often obtain copious and/or incomplete data that can be superfluous/collinear in terms of explaining particular outcomes— even sophisticated analysis software and technology struggle under these particular conditions. Purpose: compare Principal Component Analysis (PCA), Partial Least Squares (PLS), and Johnson-Lindenstrauss inspired Random Matrices (RMs) in terms of reducing dataset dimensionality while retaining practical generality by reducing bias and mean-squared error (MSE). Survival Analysis: overcomes limitations of standard regression approaches; able to include positive values; can handle censoring. Accelerated Failure Time (AFT) Model: provides intuitive interpretation of predictor and response variables via survivor curves; directly models survival times. PCA: obtains components/eigenvalues from data’s variance-covariance matrix; maximizes covariance and correlation of linear combinations of predictor variable; produces new less correlated variables by constructing orthogonal transformations of covariates. PLS: similar to PCA; however, PLS maximizes covariance and correlation of linear combinations of predictor and response variables; projects predictor and response variables into new space to model covariance structure. According to the results, PCA outperforms PLS, all three RM variants are comparable, and all RMs are superior to PCA and PLS. 1. Integrate censored data into investigation. 2. Apply findings to real datasets—e.g., microarray gene cancer data. 3. Utilize more powerful software and higher-performance technology. 4. Observe effects of altering regression model—e.g., instead of AFT Model, implement Cox Proportional Hazards Model. Achlioptas, D. Database-friendly random projections: Johnson-Lindenstrauss with binary coins. Journal of Computer and System Sciences 66(4): 671-687, 2003. Dasgupta, S. and A. Gupta. An elementary proof of a theorem of Johnson and Lindenstrauss. Random Structures and Algorithms 22(1): 60-65, 2003. Johnson, W.B. and J. Lindenstrauss. Extensions of Lipschitz maps into a Hilbert space. Contemp Math 26: 189-206,1984. Nguyen, Tuan S. and Javier Rojo. Dimension Reduction of Microarray Data in the Presence of a Censored Survival Response: A Simulation Study. Statistical Applications in Genetics and Molecular Biology 8(1): 2009. Nguyen, Tuan S. and Javier Rojo. Dimension Reduction of Microarray Gene Expression Data: The Accelerated Failure Time Model. Journal of Bioinformatics and Computational Biology 7(6): 939-954, 2009. This project was ameliorated thanks to the generous guidance and support from Javier Rojo along with Kyle Bradford, Nathan C. Wiseman, Raul Cruz-Cano, and Rashidul Hasan. This research was supported by the National Security Agency through Grant H98230-15-1-0048 to the University of Nevada at Reno, Javier Rojo PI. Analysis and Discussion RMs unexpectedly outdid PCA and PLS—could be connected to R’s accuracy limits when generating datasets and/or not incorporating censored data; PLS performs in-depth analysis of predictor and response variables, yet it was bested by PCA—could be due to dataset generation. Further Inquiry Acknowledgements and Literature Cited Results Assessment Sample Curve Introduction Methods Contribution: this research builds upon the work of Nguyen and Rojo with respect to PCA and PLS (2009); furthermore, via computer simulations, this investigation appends the results of Achlioptas (2003) and Gupta- Dasgupta (2003) in their analysis of Johnson and Lindenstrauss’s extensions of Lipschitz mappings into Hilbert spaces (1984). Methods Continued RM: matrix with predetermined random qualities; generated RM is then applied directly to predictor matrix. 1. Generate fixed regression coefficients and theoretical mean in R. 2. Obtain the true survivor curve through the AFT Model. 3. Implement all five of the dimension reduction techniques on the data. 4. Acquire estimates on the real survivor curve from each procedure. 5. Calculate bias and MSE at uniform partitions of the vertical axis. 6. Repeat steps 1-5 for the desired amount of iterations. 7. Receive total error plots to analyze given technique’s performance. Survival Analysis Dimension Reduction Techniques: A Comparison of Select Methods Iván Rodríguez† and Claressa L. Ullmayer∗ † The University of Arizona * The University of Alaska, Fairbanks