


Root Cause Analysis (RCA) techniques.pdf
- 1. Root Cause Analysis (RCA) techniques Nirmal Thomas
- 2. 5-Whys Analysis This technique is based on asking "why" repeatedly until you get to the root cause of the problem. It's a simple and effective way to drill down into the underlying causes of a problem.
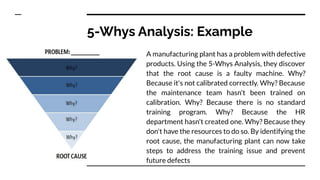
- 3. 5-Whys Analysis: Example A manufacturing plant has a problem with defective products. Using the 5-Whys Analysis, they discover that the root cause is a faulty machine. Why? Because it's not calibrated correctly. Why? Because the maintenance team hasn't been trained on calibration. Why? Because there is no standard training program. Why? Because the HR department hasn't created one. Why? Because they don't have the resources to do so. By identifying the root cause, the manufacturing plant can now take steps to address the training issue and prevent future defects
- 4. Fishbone or Ishikawa Diagram This technique is useful for organizing and categorizing the different factors that contribute to a problem. It helps to identify the different areas where improvements can be made
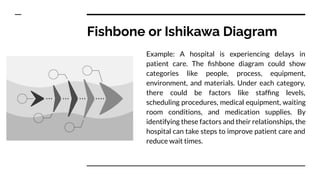
- 5. Fishbone or Ishikawa Diagram Example: A hospital is experiencing delays in patient care. The ?shbone diagram could show categories like people, process, equipment, environment, and materials. Under each category, there could be factors like staf?ng levels, scheduling procedures, medical equipment, waiting room conditions, and medication supplies. By identifying these factors and their relationships, the hospital can take steps to improve patient care and reduce wait times.
- 6. Failure Modes and E?ects Analysis (FMEA This technique is useful for identifying potential failures and their consequences, and taking steps to prevent or mitigate them. It's commonly used in industries like healthcare, manufacturing, and aviation.
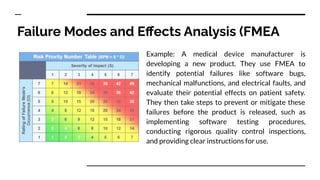
- 7. Failure Modes and E?ects Analysis (FMEA Example: A medical device manufacturer is developing a new product. They use FMEA to identify potential failures like software bugs, mechanical malfunctions, and electrical faults, and evaluate their potential effects on patient safety. They then take steps to prevent or mitigate these failures before the product is released, such as implementing software testing procedures, conducting rigorous quality control inspections, and providing clear instructions for use.
- 8. Root Cause Mapping This technique is useful for visually mapping out the causal relationships between different factors and the problem. It helps to identify the sequence of events that led to the problem.
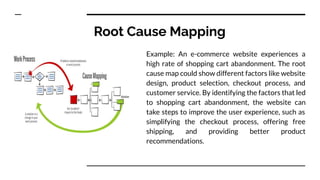
- 9. Root Cause Mapping Example: An e-commerce website experiences a high rate of shopping cart abandonment. The root cause map could show different factors like website design, product selection, checkout process, and customer service. By identifying the factors that led to shopping cart abandonment, the website can take steps to improve the user experience, such as simplifying the checkout process, offering free shipping, and providing better product recommendations.
- 10. Fault Tree Analysis This technique is useful for identifying the potential causes of a problem and their interactions. It helps to identify the combinations of factors that could lead to the problem.
- 11. Fault Tree Analysis Example: An airline experiences a safety incident. The fault tree could show different components like engines, avionics, hydraulics, and ?ight controls. It could then show the different combinations of failures that could lead to the safety incident, such as an engine failure combined with a loss of hydraulics. By identifying the potential causes and their interactions, the airline can take steps to prevent future safety incidents, such as implementing more rigorous maintenance procedures and upgrading equipment.