Rubric
•
0 likes•142 views

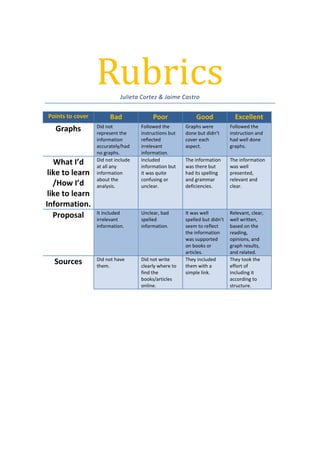
The document provides a rubric for evaluating graphs, information presented, proposals, and inclusion of sources on a scale from bad to excellent. For graphs, points are awarded based on accurate representation of information and inclusion of graphs. For what was learned and proposed, better evaluations include clear, relevant information presented with good spelling and grammar. Inclusion of sources is judged based on how clearly they are cited and linked to support the reading, opinions, and graph results.
Rubric
- 1. Rubrics Julieta Cortez & Jaime Castro Points to cover Bad Poor Good Excellent Did not Followed the Graphs were Followed the Graphs represent the instructions but done but didn’t instruction and information reflected cover each had well done accurately/had irrelevant aspect. graphs. no graphs. information. Did not include Included The information The information What I’d at all any information but was there but was well like to learn information it was quite had its spelling presented, about the confusing or and grammar relevant and /How I’d analysis. unclear. deficiencies. clear. like to learn Information. It included Unclear, bad It was well Relevant, clear, Proposal irrelevant spelled spelled but didn’t well written, information. information. seem to reflect based on the the information reading, was supported opinions, and on books or graph results, articles. and related. Did not have Did not write They included They took the Sources them. clearly where to them with a effort of find the simple link. including it books/articles according to online. structure.