Sample CS Senior Capstone Projects
Download as pptx, pdf1 like486 views

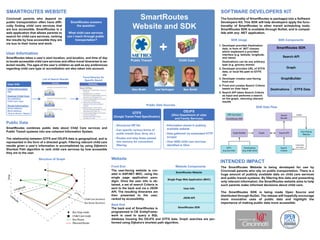
The document describes a student capstone project that analyzes traffic data through collecting tweets, traffic camera images, and weather data to provide users with a traffic analysis for Cincinnati. Various techniques are used like sentiment analysis of tweets, image processing of traffic cameras to count cars, and analyzing weather patterns. A web application was created to display the current traffic analysis on a scale and provide additional context to help users understand the reported traffic status.
Sample CS Senior Capstone Projects
- 1. Student Innovations: CS Senior Capstone Projects
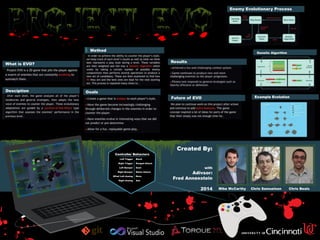
- 3. Mike McCarthy Chris Samuelson Chris Beals Created By: with Adivsor: Fred Annexstein 2014 Controller Behaviors Left Trigger Right Trigger Left Bumper Right Bumper DPad/ Left Analog Right Analog Block Ranged Attack Dash Melee Attack Move Aim What is EVO? Desciption Method Goals Future of EVO Results Enemy Evolutionary Process Example Evolution Genetic Algorithm
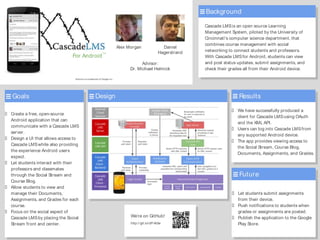
- 4. 3D Stereoscopic Modeling Andrew Janson, Josh Ellis Advisor: Dr. Paul Talaga College of Engineering and Applied Science, University of Cincinnati, Cincinnati, OH 45221 Introduction How Stereo Vision Works Methods Future Work 1 ŌĆó 3-D scanning is the process of converting physical objects to numerical data that can be geometrically represented. ŌĆó Digital models allow for testing and redesign of real objects without wasting physical resources. 3 4 Image Capture Disparity Maps 3-D Representation ŌĆó Easy to setup/use software and hardware ŌĆó Quickly capture sets of stereoscopic images ŌĆó Generate 3D model from disparity map Objectives 2 http://qz.com/96806/with-3d-printing-youll-be-able-to-replicate- the-worlds-famous-sculptures/ 5 Image Sets i. Front ii. Right iii. Back iv. Left v. Top Actual Depth Calculation Digital representation of each side Calculated height for each pixel in image Hexagonal Prism Front View Side View MeshlabApply Mesh (each side) Point Cloud ImportSave to file ŌĆó Higher resolution for better modeling ŌĆó 3-D Printing integration ŌĆó Larger scanning area ŌĆó Faster processing time Known ŌĆó D-wall ŌĆó D-center Calculate ŌĆó D-object ŌĆó Object size ŌĆó 2 images of same object (slightly different angles) ŌĆó Find pixels on each image corresponding to same point on real object ŌĆó Triangulation to calculate distance from real object to cameras Stereoscopic Camera Human Eyes 5 Stereoscopic Image
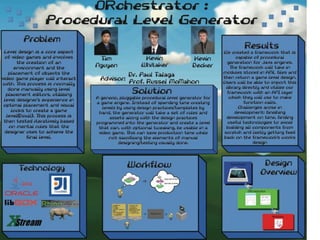
- 6. For AndroidŌäó Daniel Hagerstrand Alex Morgan Advisor: Dr. Michael Helmick Background Design Cascade LMSis an open source Learning Management System, piloted by the University of Cincinnati's computer science department, that combines course management with social networking to connect students and professors. With Cascade LMSfor Android, students can view and post status updates, submit assignments, and check their grades all from their Android device. Android is a trademark of Google Inc. Results Ō×ö We have successfully produced a client for Cascade LMSusing OAuth and the XML API. Ō×ö Users can log into Cascade LMSfrom any supported Android device. Ō×ö The app provides viewing access to the Social Stream, Course Blog, Documents, Assignments, and Grades. Goals Ō×ö Create a free, open-source Android application that can communicate with a Cascade LMS server. Ō×ö Design a UI that allows access to Cascade LMSwhile also providing the experience Android users expect. Ō×ö Let students interact with their professors and classmates through the Social Stream and Course Blog. Ō×ö Allow students to view and manage their Documents, Assignments, and Grades for each course. Ō×ö Focus on the social aspect of Cascade LMSby placing the Social Stream front and center. WeŌĆÖre on GitHub! http://git.io/dP-AGw Future Ō×ö Let students submit assignments from their device. Ō×ö Push notifications to students when grades or assignments are posted. Ō×ö Publish the application to the Google Play Store.
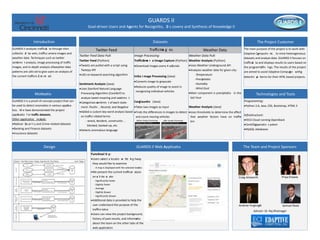
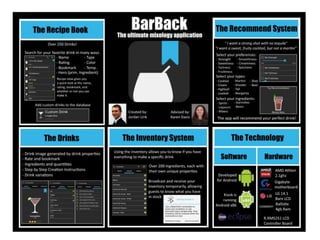
- 8. GUARDS II Goal-driven Users and Agents for Recognition , Di s covery and Synthesis of Knowledge II Introduction Technologies and Tools Datasets GUARDS II analyzes trafficda ta through the collectio n of tw eets, trafficc amera images and weather data. Techniques such as twitter sentime n t analysis, image processing of traffic images, and in-depth analysis of weather data patterns are util i z ed to give users an analysis of the current trafficin Ci nci nn ati. Programming: Python 2.6, Java, CSS, Bootstrap, HTML 5 Infrastructure: EECS Cloud running OpenStack CentOS operating s ystem MySQL databases Twitter Feed Data Pull: Twitter Feed (Python) Tweets are pulled with a script using Tweepy API Util i z es keyword searching algorithm Sentiment Analysis (Java) Uses Stanford Natural Language Processing Algorithm (CoreNLP) to analyze tweet meaning and sentime n t Categorizes sentime n t of each state- ment: Positiv e , Neutral, and Negative Added a custom key word analysis based on trafficr elated terms - wreck, incident, construction , blocked, backed-up, etc. Detects anomalous language The Team and Project Sponsors Motivation GUARDS II is a proof-of-concept project that can be used to detect anomalies in various applica- tio n s. W e have demonstrated the project application f or traffic datasets. Other application s include: Natio n al Secur it y and Crime-related datasets Banking and Finance datasets Insurance datasets Image Processing: TrafficCame r a Image Capture (Python) Download images every 4 seconds Initia l I mage Processing (Java) Converts image to grayscale Reduces quality of image to assist in recognizing individual vehicles Car Counting (Java) Takes two images as input Finds the differences in images to detect and count moving vehicles TrafficIma g es Weather Data Pull: Weather Analysis (Python) Uses Weather Underground API Analyzes weather data for given city: -Temperature -Precipitation -Humidity -Wind Gust Main component is precipitation in the last hour Weather Analysis (Java) Uses thresholds to determine the effect that weather factors have on traffic tim e Weather DataTwitter Feed Design The Project Customer The main purpose of the project is to work with Edaptive Computing Inc. to mine heterogeneous datasets and analyze data. GUARDS II focuses on trafficda ta and displays results to users based on the programŌĆÖs find ings. The results of the project are aimed to assist Edaptive Computing with detectin g pa tterns for their AFRL based projects. GUARDS II Web Application Craig Ashworth Priya Chawla Samuel ReedAndrew Yingling Functio n al it y: Users select a location on the hi g hway they would like to examine - A map is displayed with the selected location We present the current traffican alysis on a 5-tier sc ale: - Significantly Faster - Slightly Faster - Average - Slightly Slower - Significantly Slower Additional data is provided to help the user understand the purpose of the traffics tatus Users can view the project background, history of past results, and information about the team on the other tabs of the web application Before Image Processing: After Image Processing: Advisor: Dr. Raj Bhatnagar