Sample Deliverable Dashboard
•
0 likes•585 views

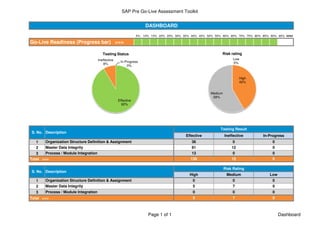
This document is a dashboard summarizing the status of testing for an SAP system pre go-live assessment. It shows that testing is 92% effective with no ineffective testing and 8% still in progress. It also indicates the project has medium risk levels overall with 42% at high risk, 58% at medium risk, and 0% at low risk. The dashboard provides testing result and risk rating details for three key areas: organization structure, master data integrity, and process/module integration.
Sample Deliverable Dashboard
- 1. SAP Pre Go-Live Assessment Toolkit DASHBOARD 5% 10% 15% 20% 25% 30% 35% 40% 45% 50% 55% 60% 65% 70% 75% 80% 85% 90% 95% #### Go-Live Readiness (Progress bar) >>> YES YES YES YES YES YES YES YES YES YES YES YES YES YES YES YES YES YES NO NO Testing Status Risk rating Ineffective Low In-Progress 0% 8% 0% High 42% Medium 58% Effective 92% Testing Result S. No. Description Effective Ineffective In-Progress 1 Organization Structure Definition & Assignment 36 0 0 2 Master Data Integrity 81 12 0 3 Process / Module Integration 13 0 0 Total >>> 130 12 0 Risk Rating S. No. Description High Medium Low 1 Organization Structure Definition & Assignment 0 0 0 2 Master Data Integrity 5 7 0 3 Process / Module Integration 0 0 0 Total >>> 5 7 0 Page 1 of 1 Dashboard