Sdrc data chain
•
0 likes•844 views

At SDRC we are trying to re-engineer the social data chain for maximizing the impact of social change initiatives.


Sdrc data chain
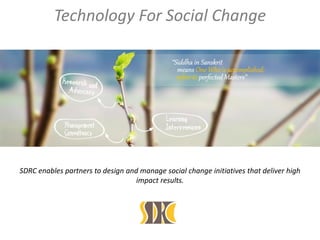
- 1. SDRC enables partners to design and manage social change initiatives that deliver high impact results. Technology For Social Change
- 2. the missing bridge paradox
- 6. How to do it? www.sdrc.co.in
- 10. Data Collection 1) Paper based forms are transformed to electronic questionnaires using XLS, XML and other related technologies. The electronic questionnaires can then be used in Android based mobile devices ( Phones, Tablets) as well as for data collection via a web browser. 2) Forms can be used to capture both qualitative and quantitative data(Geo tagged images, audio and video recordings etc) 3) Complex validations and skip patterns can be included to ensure data quality, and completeness of the survey 4) Forms work in both online and offline mode. Enumerators can collect data from the field in offline mode, and then push the data to the centralized server when they are online.
- 11. Data Collation 1) Data collected from multiple devices is then collated in a centralized server. 2) Collected data can be exported into CSV files. 3) We can then develop aggregation logic to aggregate the data across various categories
- 12. Data Sharing 1) Analysed and aggregated data can then be represented in a visually engaging and interactive dashboard. 2) Functionality to share the aggregated and analysed data as pdf and xls files can be built. 3) The online dashboard can represent analyses and aggregated data from multiple rounds of data collection, across geographies for multiples of indicators and sectors.
- 13. www.sdrc.co.in Data chain in action
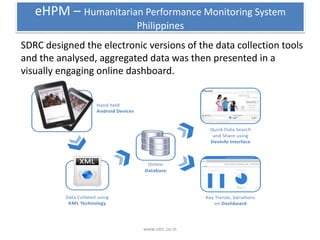
- 14. www.sdrc.co.in eHPM – Humanitarian Performance Monitoring System Philippines SDRC designed the electronic versions of the data collection tools and the analysed, aggregated data was then presented in a visually engaging online dashboard.
- 15. www.sdrc.co.in Emergency Response – Phailin Needs Assessment
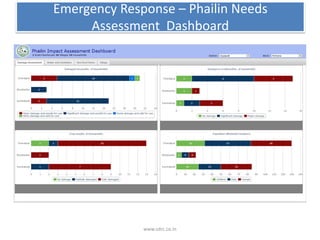
- 16. www.sdrc.co.in Phailin Needs Assessment Dashboard Odisha India SDRC designed the electronic versions of the data collection tools and the analysed, aggregated data was then presented in a visually engaging online dashboard.
- 17. www.sdrc.co.in Emergency Response – Phailin Needs Assessment Dashboard
- 19. `Logical View of Devinfo SMEs, DB AdministratorSMEs, DB Administrator Users, Decision makersUsers, Decision makers DevInfo 7.0 Database Administration (Windows Forms application) Operates Define IUS Data Exchange utility , Import Export Validation Tools, Reporting .tpl Files.tpl Files Data Entry & Validation Extract Database DevInfo 7.0 User Web application Devinfo Databases ResponseRequest Web Services As APIs DevelopersDevelopers Request Response WebApplicaiton Composable UI Web pages And Visualization User administration and Personalization Adhoc reporting and visualization Asynchronous Operation JSON/XML Browsers