Selected Problems Of Marine Traffic Risk Modelling
- 1. Selected problems of maritime traffic risk modelling Pentti Kujala, Professor Jakub Montewka, Ph.D., Chief Mate Aalto University, Finland Przemysław Krata, Ph.D. Maritime University of Gdynia, Poland Stockholm, 28-29 January 2010
- 2. Agenda Risk modelling - outline Probability of an accident Consequences A case study Selected problems of maritime traffic risk modelling
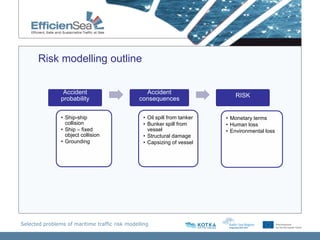
- 3. Risk modelling outline P C R P ŌĆō accidentŌƤs probability C ŌĆō accidentŌƤs consequences R ŌĆō risk Selected problems of maritime traffic risk modelling
- 4. Risk modelling outline Accident Accident RISK probability consequences ŌĆó Ship-ship ŌĆó Oil spill from tanker ŌĆó Monetary terms collision ŌĆó Bunker spill from ŌĆó Human loss ŌĆó Ship ŌĆō fixed vessel ŌĆó Environmental loss object collision ŌĆó Structural damage ŌĆó Grounding ŌĆó Capsizing of vessel Selected problems of maritime traffic risk modelling
- 5. AccidentŌƤs probability assessment Ship-ship collision Ship-fixed object Grounding models models collision models Fujii, Macduff, Fujii, Macduff, 1974 Gluver&Olsen ŌĆ×98 1974 Kite ŌĆō Powell, Pedersen, 1995 U. Kunz, 1998 1999 MDTC based M. Knott, 1998 Fowler, 2000 model, 2010 Z. Prucz, 1998 Quy, 2007 Gravity model, 2010 Selected problems of maritime traffic risk modelling
- 6. Collision probability assessment ŌĆō MDTC based model Figure The relationships between MDTC, safe passing distance, and collision Figure Representation of vessels as discs and definition of collision situation. Selected problems of maritime traffic risk modelling
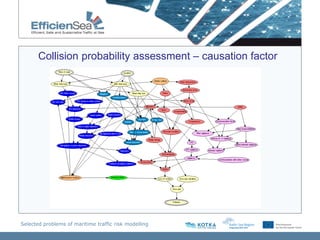
- 7. Collision probability assessment ŌĆō MDTC based model MDTC (LOA) Tanker_Tanker 5 Tankers_cd Tanker_Pass Tanker_Pass_cd 4 Pass_Cont Pass_Cont_cd Cont_diff 3 Cont_diff_cd MDTC (LOA) RoRo_RoRo 6 RoRo_cd 2 Cont_Cont Cont_cd 5 Tankers_diff 1 Tankers_diff_cd 4 Pass_Pass 0 Pass_Pass_cd 3 10 30 50 70 90 110 130 150 170 Angle of intersection (deg) 2 Figure 1 Values of MDTC obtained for all meeting scenarios, with corresponding values of collision diameters. 0 0 20 40 60 80 100 120 140 160 180 Angle of intersection (deg) 1_port_2_stb Both_to_port CD Figure MDTC and CDŌĆÖs values computed at 95% confidence level by use of Monte Carlo simulations. Selected problems of maritime traffic risk modelling
- 8. Collision probability assessment ŌĆō causation factor Selected problems of maritime traffic risk modelling
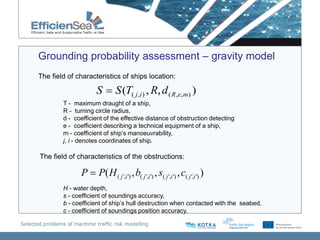
- 9. Grounding probability assessment ŌĆō gravity model The field of characteristics of ships location: S S (T( j ,i ) , R, d ( R,e,m) ) T - maximum draught of a ship, R - turning circle radius, d - coefficient of the effective distance of obstruction detecting e - coefficient describing a technical equipment of a ship, m - coefficient of shipŌƤs manoeuvrability, j, i - denotes coordinates of ship. The field of characteristics of the obstructions: P P( H ( j ',i ') , b( j ',i ') , s( j ',i ') , c( j ',i ') ) H - water depth, s - coefficient of soundings accuracy, b - coefficient of shipŌƤs hull destruction when contacted with the seabed, c - coefficient of soundings position accuracy. Selected problems of maritime traffic risk modelling
- 10. Grounding probability assessment ŌĆō gravity model The grounding threat intensity at any arbitrarily chosen point of the space containing any number of sources of a threat (eg.: shallows) can be obtained as a vector sum of grounding threat intensities coming from every single obstruction according to the formula: np E ( j, i) Ek k 1 ─Æ(j,i) - is a grounding threat intensity field in the point (j, i), ─Æ k - is a grounding threat intensity vector generated by k-numbered obstruction, np - is a number of obstructions located in considered area. Selected problems of maritime traffic risk modelling
- 11. Grounding probability assessment ŌĆō gravity model A spatial distribution of values of the grounding threat intensity vectors. A shape of a safety contour (blue) depends on the assumption regarding the acceptable value of the grounding threat intensity vectors in the closest point of shallow approach. The critical value adjustment was performed on the basis of a minimum under keel clearance (UKC) requirement. Blue means safety Centre of fairway Selected problems of maritime traffic risk modelling
- 12. AccidentŌƤs consequences assessment Quantity of oil spill Cost of oil spill Structural damage Ship capsizing IMO methodology Munif et al. MEPC 117(52) 2004 Etkin, 2000 Pedersen, 1994 2005 MEPC 110(49) 2003 Skjong et al. 2005 Bulian et al. Smailys & ─īesnauskis, Brown, 2002 2009 2006 in SAFEDOR project In house build model Zhang, Hinz, 2010 based on the two above mentioned, 2009 Yasuhira, 2009 In house build model, based on ZhangŌƤs approach and AIS data2010 Selected problems of maritime traffic risk modelling
- 13. AccidentŌƤs consequences assessment Size of an oil outflow due to collision and grounding considering there is a spill as a function of cargo deadweight as calculated by IMO probabilistic methodology for double hull tankers only. Collision Grounding Selected problems of maritime traffic risk modelling
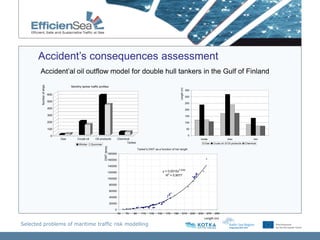
- 14. AccidentŌƤs consequences assessment AccidentŌƤal oil outflow model for double hull tankers in the Gulf of Finland Number of ships Monthly tanker traffic profiles Length (m) 350 600 300 500 250 400 200 300 150 200 100 100 50 0 0 Gas Crude oil Oil products Chemical mode max min Tanker Gas Crude oil Oil products Chemical Winter Summer DWT (tons) Tanker's DWT as a function of her length 180000 160000 140000 120000 y = 0,0015x3,3008 2 R = 0,9577 100000 80000 60000 40000 20000 0 50 70 90 110 130 150 170 190 210 230 250 270 290 Length (m) Selected problems of maritime traffic risk modelling
- 15. AccidentŌƤs consequences assessment AccidentŌƤal oil outflow model for double hull tankers in the Gulf of Finland X > 21125 Pareto2(9009.10; 1.90) Shift=+3.04 X > 34485 Pareto2(49459; 8.4) Shift=-3.16 5.0% 5.0% Probability 2,0E-04 Probability 1,5E-04 1,5E-04 1,0E-04 1,0E-04 5,0E-05 5,0E-05 0,0E+00 0,0E+00 0 10000 20000 30000 40000 50000 0 10000 20000 30000 40000 50000 Spill size [t] Spill size [t] The probability of an oil spill from the tankers operating in the Gulf of Finland in case of collision, estimated by Pareto2 distributions for summer (to left) and winter traffic (to right). Selected problems of maritime traffic risk modelling
- 16. A case study Block diagram of risk assessment process applied in the study. Selected problems of maritime traffic risk modelling
- 17. A case study 1. Helsinki-Tallinn crossing for summer and winter traffic. 2. Approach to oil terminal in Sk├Čldvik Selected problems of maritime traffic risk modelling
- 18. A case study Cumulative density functions of risk due to tankers collisions in the Helsinki- Tallinn crossing for summer and winter traffic. X <0.43 Lognorm(123682; 246804) Shift=-1123.4 X > 444368 95% 5.0% Probability 1 Probability 1 Mean = 122559 0,8 Summer 0,8 Mean=0.19 0,6 0,6 Winter 0,4 Mean=0.14 0,4 0,2 0,2 0 0 0 0,25 0,5 0,75 1 0 0,1 0,2 0,3 0,4 0,5 0,6 RISK [USD*Million] RISK [USD*Millions] Selected problems of maritime traffic risk modelling
- 19. A case study The safety contours of the analyzed fairway to Sk├Čldvik (red and green curves) and the fairway centre line (black straight line). 60,15 Latitude [deg N] 60,14 Histograms of tankers' lateral distribution on fairway 60,13 leading to Sk├Čldvig Probability 0,0020 60,12 0,0015 60,11 0,0010 60,1 60,09 0,0005 60,08 0,0000 -750 -500 -250 0 250 500 750 1000 1250 60,07 Distance from waterway center [m] S_bound N_bound 60,06 25,5 25,52 25,54 25,56 25,58 25,6 25,62 Longitude [deg E] Two histograms of tankersŌƤ lateral distribution on the fairway to Sk├Čldvig, red line represents north bound traffic whereas black line is south bound traffic The safety contours Selected problems of maritime traffic risk modelling
- 20. A case study Probability and cumulative density functions of variable ŌĆ£riskŌĆØ in case of grounding in the Sk├Čldvik harbour approach, summer traffic. Lognorm(123682; 246804) Shift=-1123.4 X > 444368 Lognorm(123682; 246804) Shift=-1123.4 X > 444368 5,0% 5.0% Probability Probability 1,2E-05 1 Mean = 122559 1,0E-05 Mean = 122559 0,8 8,0E-06 0,6 6,0E-06 0,4 4,0E-06 2,0E-06 0,2 0,0E+00 0 0 0,1 0,2 0,3 0,4 0,5 0,6 0 0,1 0,2 0,3 0,4 0,5 0,6 RISK [USD*Millions] RISK [USD*Millions] Selected problems of maritime traffic risk modelling
- 21. Thank you for your attention Selected problems of maritime traffic risk modelling
- 22. Selected problems of maritime traffic risk modelling Pentti Kujala, Professor Jakub Montewka, Ph.D., Chief Mate Aalto University, Finland Przemysław Krata, Ph.D. Maritime University of Gdynia, Poland Stockholm, 28-29 January 2010






![AccidentŌƤs consequences assessment
AccidentŌƤal oil outflow model for double hull tankers in the Gulf of Finland
X > 21125
Pareto2(9009.10; 1.90) Shift=+3.04 X > 34485 Pareto2(49459; 8.4) Shift=-3.16
5.0%
5.0%
Probability
2,0E-04
Probability
1,5E-04
1,5E-04
1,0E-04
1,0E-04
5,0E-05
5,0E-05
0,0E+00 0,0E+00
0 10000 20000 30000 40000 50000 0 10000 20000 30000 40000 50000
Spill size [t] Spill size [t]
The probability of an oil spill from the tankers operating in the Gulf of Finland in case of collision,
estimated by Pareto2 distributions for summer (to left) and winter traffic (to right).
Selected problems of maritime traffic risk modelling](https://image.slidesharecdn.com/dnvstockholmselectedproblemsofmarinetrafficriskmodelling012010-126691291851-phpapp01/85/Selected-Problems-Of-Marine-Traffic-Risk-Modelling-15-320.jpg)


![A case study
Cumulative density functions of risk due to tankers collisions in the Helsinki-
Tallinn crossing for summer and winter traffic.
X <0.43
Lognorm(123682; 246804) Shift=-1123.4 X > 444368
95% 5.0%
Probability
1
Probability
1
Mean = 122559
0,8 Summer 0,8
Mean=0.19
0,6 0,6
Winter
0,4 Mean=0.14 0,4
0,2 0,2
0 0
0 0,25 0,5 0,75 1 0 0,1 0,2 0,3 0,4 0,5 0,6
RISK [USD*Million] RISK [USD*Millions]
Selected problems of maritime traffic risk modelling](https://image.slidesharecdn.com/dnvstockholmselectedproblemsofmarinetrafficriskmodelling012010-126691291851-phpapp01/85/Selected-Problems-Of-Marine-Traffic-Risk-Modelling-18-320.jpg)
![A case study
The safety contours of the analyzed fairway to Sk├Čldvik (red and green curves)
and the fairway centre line (black straight line).
60,15
Latitude [deg N]
60,14
Histograms of tankers' lateral distribution on fairway
60,13 leading to Sk├Čldvig
Probability
0,0020
60,12
0,0015
60,11
0,0010
60,1
60,09 0,0005
60,08 0,0000
-750 -500 -250 0 250 500 750 1000 1250
60,07 Distance from waterway center [m]
S_bound N_bound
60,06
25,5 25,52 25,54 25,56 25,58 25,6 25,62
Longitude [deg E]
Two histograms of tankersŌƤ lateral distribution on the fairway to
Sk├Čldvig, red line represents north bound traffic whereas black
line is south bound traffic
The safety contours
Selected problems of maritime traffic risk modelling](https://image.slidesharecdn.com/dnvstockholmselectedproblemsofmarinetrafficriskmodelling012010-126691291851-phpapp01/85/Selected-Problems-Of-Marine-Traffic-Risk-Modelling-19-320.jpg)
![A case study
Probability and cumulative density functions of variable ŌĆ£riskŌĆØ in case of grounding in
the Sk├Čldvik harbour approach, summer traffic.
Lognorm(123682; 246804) Shift=-1123.4 X > 444368 Lognorm(123682; 246804) Shift=-1123.4 X > 444368
5,0% 5.0%
Probability
Probability
1,2E-05 1
Mean = 122559
1,0E-05
Mean = 122559 0,8
8,0E-06
0,6
6,0E-06
0,4
4,0E-06
2,0E-06 0,2
0,0E+00 0
0 0,1 0,2 0,3 0,4 0,5 0,6 0 0,1 0,2 0,3 0,4 0,5 0,6
RISK [USD*Millions] RISK [USD*Millions]
Selected problems of maritime traffic risk modelling](https://image.slidesharecdn.com/dnvstockholmselectedproblemsofmarinetrafficriskmodelling012010-126691291851-phpapp01/85/Selected-Problems-Of-Marine-Traffic-Risk-Modelling-20-320.jpg)

