Sentiment analysis on airlines
?
0 likes?587 views

This document discusses performing sentiment analysis on tweets related to three major US airlines: Delta, JetBlue, and United. It outlines extracting tweets using Twitter APIs, processing the tweets by identifying sentiment words and scoring sentiment, and generating graphs to analyze and compare sentiment polarity between the airlines. The analysis found that JetBlue had the highest percentage of positive sentiment compared to the other airlines, indicating customers generally liked JetBlue more. Sentiment analysis can help airlines understand customer feedback to improve services and brand image.


Sentiment analysis on airlines
- 1. 1 Sentiment Analysis on Airlines Group 5 Mounika Bandam Piyush Srivastava Sivannarayana Ravipati ABSTRACT Sentiment analysis or opinion mining refers to the use of natural language processing (NLP), text analysis and computational linguistics to identify and extract subjective information from the source materials. Business enterprises can leverage opinion polarity and sentiment topic recognition to gain deeper understanding of the drivers and the overall scope. We are doing the sentiment analysis on aviation sector which can help aviation companies detect sentiment polarity and sentiment topics by making use of data (text) and examining the reputation of airlines by computing their Airline Quality Rating (AQR). we have considered the leading US airliners Delta, JetBlue and United Airlines to perform the sentiment analysis by collecting the data (messages) from the Twitter. These messages are classified as positive or neutral or negative with respect to a query term. 1. INTRODUCTION Twitter is a popular microblogging service where users create status messages (called °∞tweets°±). These tweets sometimes express opinions about different topics. This is very useful because it allows feedback to be aggregated without manual intervention. Consumers can use sentiment analysis to research products or services before booking a flight. Marketers can use this to research public opinion of their company and products, or to analyze customer satisfaction. Organizations can also use this to gather critical feedback about problems in newly released products. There has been a large amount of research in sentiment classification. With the large range of topics discussed on Twitter, it would be very difficult to manually collect enough data to do the sentiment analysis for tweets. Hence, we have used publicly available twitter datasets.
- 2. 2 2. EXTRACTING TWEETS To extract the tweets, we need to establish a connection with the twitter and we can do that with TwitterR. TwitterR offers an easy way to extract tweets containing a given hashtag, word or term from a user°Øs account or public tweets. However, before loading TwitterR library and using its functions, we need to create an app on dev.twitter.com and then we should run the following code (We have written the code R language) to set authorization to extract tweets. We need to load the required libraries for processing the tweets and plot the graphs as below. Now we are ready with the libraries and accessing the tweets. So, the next step is to import files containing a dictionary of positive and negative words. Likewise, text files containing positive and negative sentiments can be imported using the below code. Now we need to extract specific tweets relating to Delta, JetBlue and United airlines by querying the twitter for tweets with the hashtag using the below code. 3. PROCESSING TWEETS To process the tweets, we should go through the following steps. Step 1: Converting the tweets to a text format. Step 2: Calculating the number of tweets for each airline. Step 3: Combining the text of all these airlines.
- 3. 3 4. SENTIMENT ANALYSIS APPLICATION The code below showcases how sentiment analysis is written and executed. However, before we proceed with sentiment analysis, a function needs to be defined that will calculate the sentiment score. Now, we can start processing the tweets to calculate the sentiment score. Step 1: Create the variable in scores data frame. Step 2: Calculate the positive, negative and neutral sentiments. There are many ways to define the sentiment levels and we have chosen to follow the below method. Step 3: Split the data frame into individual datasets for each airline. Step 4: Create polarity variable for each data frame.
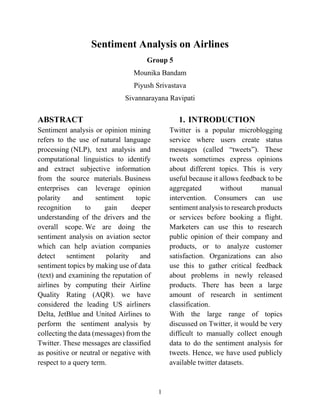
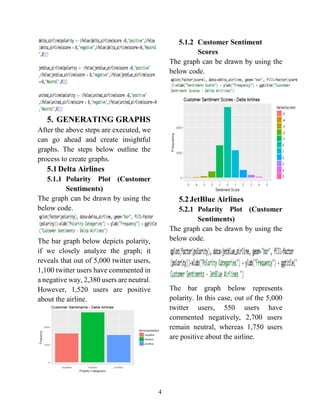
- 4. 4 5. GENERATING GRAPHS After the above steps are executed, we can go ahead and create insightful graphs. The steps below outline the process to create graphs. 5.1Delta Airlines 5.1.1 Polarity Plot (Customer Sentiments) The graph can be drawn by using the below code. The bar graph below depicts polarity, if we closely analyze the graph; it reveals that out of 5,000 twitter users, 1,100 twitter users have commented in a negative way, 2,380 users are neutral. However, 1,520 users are positive about the airline. 5.1.2 Customer Sentiment Scores The graph can be drawn by using the below code. 5.2JetBlue Airlines 5.2.1 Polarity Plot (Customer Sentiments) The graph can be drawn by using the below code. The bar graph below represents polarity. In this case, out of the 5,000 twitter users, 550 users have commented negatively, 2,700 users remain neutral, whereas 1,750 users are positive about the airline.
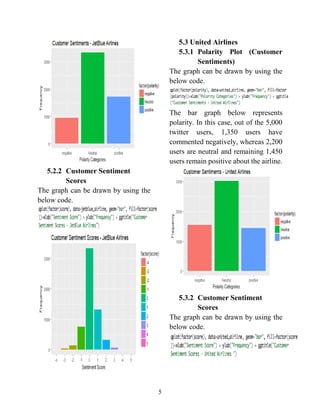
- 5. 5 5.2.2 Customer Sentiment Scores The graph can be drawn by using the below code. 5.3 United Airlines 5.3.1 Polarity Plot (Customer Sentiments) The graph can be drawn by using the below code. The bar graph below represents polarity. In this case, out of the 5,000 twitter users, 1,350 users have commented negatively, whereas 2,200 users are neutral and remaining 1,450 users remain positive about the airline. 5.3.2 Customer Sentiment Scores The graph can be drawn by using the below code.
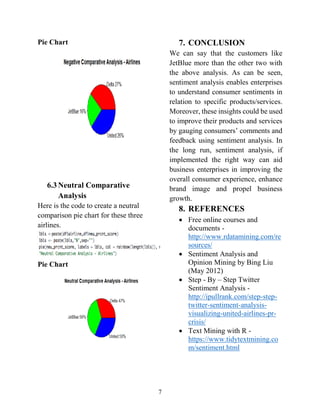
- 6. 6 6. AIRLINES COMPARISION We have seen how each airline is doing in the above chapter. Now, let°Øs see the airline progress when compared to each other. To get this we need to calculate the percentage scores of each airline and this can be done using the below code. Step 1: Summarizing the overall positive, negative and neutral scores. Step 2: Calculating the total score of each airline by adding positive, negative and neutral scores. Step 3: Calculating the percentage scores. 6.1Positive Comparative Analysis Here is the code to create a positive comparison pie chart for these three airlines. Pie Chart 6.2Negative Comparative Analysis Here is the code to create a negative comparison pie chart for these three airlines.
- 7. 7 Pie Chart 6.3Neutral Comparative Analysis Here is the code to create a neutral comparison pie chart for these three airlines. Pie Chart 7. CONCLUSION We can say that the customers like JetBlue more than the other two with the above analysis. As can be seen, sentiment analysis enables enterprises to understand consumer sentiments in relation to specific products/services. Moreover, these insights could be used to improve their products and services by gauging consumers°Ø comments and feedback using sentiment analysis. In the long run, sentiment analysis, if implemented the right way can aid business enterprises in improving the overall consumer experience, enhance brand image and propel business growth. 8. REFERENCES ? Free online courses and documents - http://www.rdatamining.com/re sources/ ? Sentiment Analysis and Opinion Mining by Bing Liu (May 2012) ? Step - By ®C Step Twitter Sentiment Analysis - http://ipullrank.com/step-step- twitter-sentiment-analysis- visualizing-united-airlines-pr- crisis/ ? Text Mining with R - https://www.tidytextmining.co m/sentiment.html