際際滷

際際滷Share a Scribd company logo
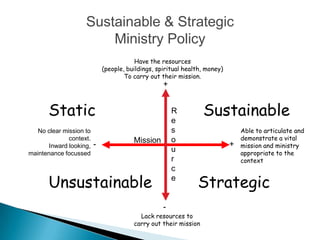
Sustainable & Strategic
                        Ministry Policy
                                         Have the resources
                             (people, buildings, spiritual health, money)
                                     To carry out their mission.
                                                   +


       Static                                          R
                                                       e
                                                                  Sustainable
   No clear mission to                                 s                        Able to articulate and
              context.                  Mission        o                        demonstrate a vital
      Inward looking,    -                                                  +   mission and ministry
maintenance focussed
                                                       u                        appropriate to the
                                                       r                        context
                                                       c

       Unsustainable                                   e
                                                               Strategic
                                                   -
                                          Lack resources to
                                        carry out their mission
The Current Reality
   8% of congregations          39% experienced a
    have experienced              decline of less than 25%
    catastrophic decline in      17% experienced
    attendance in excess of       numeric growth.
    50%,                         Total average Sunday
   36% of congregations          attendance declined
    experienced alarming          5,355 people from 28,
    levels of decline in          605 to 23,250.
    excess of 25%.
Diocese of Toronto, ASA and Easter Attendance 2000-2009
                               Sunday            Easter           Poly. (Sunday)          Poly. (Easter)


   58906      59254      58459

                                                          53628
                                         52368
                                                                       51053        50633          49639
                                                                                                                         47889
                                                                                                              46704


28605      28663
                      27272        26568           25674          25528        24754          23716        23316      23250


  2000       2001       2002            2003          2004           2005          2006          2007        2008       2009
Year   Full-Time Clergy
      2001         209
      2002         215
      2003         207
                                      Retirement Projections Based on Eligibility
      2004         199
                                12%
      2005         190          10%
                                              9.7%
                                8%
      2006         187
                                6%
                                                       5.1%                   5.1%                          4.6% 4.6%
      2007         190          4%                                 4.6%                       3.7%
                                                                                                        3.7%
                                                           3.2%                        2.8%                              2.8%
      2008         184          2%

                                0%
      2009         186


                                       2011

                                                2012

                                                         2013

                                                                2014

                                                                       2015

                                                                                2016

                                                                                         2017

                                                                                                 2018

                                                                                                          2019

                                                                                                                 2020

                                                                                                                        2021
      2010         179
Numerical          30
Change
Percentage    14% decrease
Change
Year          #      %      Est. Ordinations   Est. Total Full-time

Already Retired   14    6.5%

     2011         21    9.7%           11                  169

     2012         11    5.1%           6                   164

     2013         7     3.2%

     2014         10    4.6%

     2015         11    5.1%

     2016         6     2.8%

     2017         8     3.7%

     2018         8     3.7%

     2019         10    4.6%

     2020         10    4.6%

     2021         6     2.8%

   2011-21        122   56.5%
   More than half of Canadians in the 15-to-29 age
    cohort either have no religion or never attend a
    service of worship, says Statistics Canada.
   Only 22 per cent say religion is very important to
    them, down from 34 per cent in 2002.
   What growth there has been in religious
    participation has been due to immigration.
    Unfortunately for us, the current source
    countries for immigration are not predominantly
    Christian let alone Anglican.
   Full time planter to Mandarin Population
   New Church Plant underway in Ajax
   Internal church plant to Urban Trend-setters
    downtown
   Intentional missional renewal/reboots at two
    historic downtown parishes
   Reclustering/hub parishes in Trent-Durham
   Fresh Expressions/Reach Grants spawning
   Missional Transformation Process
    (14 parishes, to 25 by 2013)
So, wheres the growth?
   Layering of age-cohort data over congregational
    statistics has pointed out some further areas of
    concern:
     o   Identified 11 congregations that are terminal,
         continuous significant decline beyond likelihood
         of turnaround, unable to sustain ministry and
         plant
     o   15 congregations in peril  significant continuing
         decline in ASA makes sustainability unlikely,
         concerning age profile with significant number of
         congregation over 65
Where is the greatest decline?


                   York Mills Scarborough
                     -420        -660

                   Eglinton
                    -582

       Etobicoke
         -412
"Toto, I've
  a feeling
 we're not
 in Kansas
anymore."

More Related Content

Session 1: Diocese of Toronto Clergy Conference 2012

  • 1. Sustainable & Strategic Ministry Policy Have the resources (people, buildings, spiritual health, money) To carry out their mission. + Static R e Sustainable No clear mission to s Able to articulate and context. Mission o demonstrate a vital Inward looking, - + mission and ministry maintenance focussed u appropriate to the r context c Unsustainable e Strategic - Lack resources to carry out their mission
  • 3. 8% of congregations 39% experienced a have experienced decline of less than 25% catastrophic decline in 17% experienced attendance in excess of numeric growth. 50%, Total average Sunday 36% of congregations attendance declined experienced alarming 5,355 people from 28, levels of decline in 605 to 23,250. excess of 25%.
  • 4. Diocese of Toronto, ASA and Easter Attendance 2000-2009 Sunday Easter Poly. (Sunday) Poly. (Easter) 58906 59254 58459 53628 52368 51053 50633 49639 47889 46704 28605 28663 27272 26568 25674 25528 24754 23716 23316 23250 2000 2001 2002 2003 2004 2005 2006 2007 2008 2009
  • 5. Year Full-Time Clergy 2001 209 2002 215 2003 207 Retirement Projections Based on Eligibility 2004 199 12% 2005 190 10% 9.7% 8% 2006 187 6% 5.1% 5.1% 4.6% 4.6% 2007 190 4% 4.6% 3.7% 3.7% 3.2% 2.8% 2.8% 2008 184 2% 0% 2009 186 2011 2012 2013 2014 2015 2016 2017 2018 2019 2020 2021 2010 179 Numerical 30 Change Percentage 14% decrease Change
  • 6. Year # % Est. Ordinations Est. Total Full-time Already Retired 14 6.5% 2011 21 9.7% 11 169 2012 11 5.1% 6 164 2013 7 3.2% 2014 10 4.6% 2015 11 5.1% 2016 6 2.8% 2017 8 3.7% 2018 8 3.7% 2019 10 4.6% 2020 10 4.6% 2021 6 2.8% 2011-21 122 56.5%
  • 7. More than half of Canadians in the 15-to-29 age cohort either have no religion or never attend a service of worship, says Statistics Canada. Only 22 per cent say religion is very important to them, down from 34 per cent in 2002. What growth there has been in religious participation has been due to immigration. Unfortunately for us, the current source countries for immigration are not predominantly Christian let alone Anglican.
  • 8. Full time planter to Mandarin Population New Church Plant underway in Ajax Internal church plant to Urban Trend-setters downtown Intentional missional renewal/reboots at two historic downtown parishes Reclustering/hub parishes in Trent-Durham Fresh Expressions/Reach Grants spawning Missional Transformation Process (14 parishes, to 25 by 2013)
  • 9. So, wheres the growth?
  • 10. Layering of age-cohort data over congregational statistics has pointed out some further areas of concern: o Identified 11 congregations that are terminal, continuous significant decline beyond likelihood of turnaround, unable to sustain ministry and plant o 15 congregations in peril significant continuing decline in ASA makes sustainability unlikely, concerning age profile with significant number of congregation over 65
  • 11. Where is the greatest decline? York Mills Scarborough -420 -660 Eglinton -582 Etobicoke -412
  • 12. "Toto, I've a feeling we're not in Kansas anymore."