


![ÔÅÆ
ÔÅÆ
ÔÅÆ
ÔÅÆ
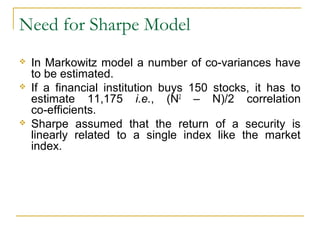
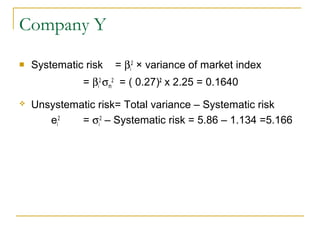
σ2p = [ ( .5 x .71 + .5 x .27)2 2.25 ] + [ ( .5)2 (5.166) + (.5 )2 ( 5.696) ]
= [ ( .355 + .135 )2 2.25 ] + [ ( 1.292 + 1.424 ) ]
= 0.540 + 2.716
= 3.256](https://image.slidesharecdn.com/sharpeindexmodel-140104220433-phpapp01/85/Sharpe-index-model-11-320.jpg)


![ÔÅÆ
ÔÅÆ
ÔÅÆ
ÔÅÆ
ÔÅÆ
ÔÅÆ
ÔÅÆ
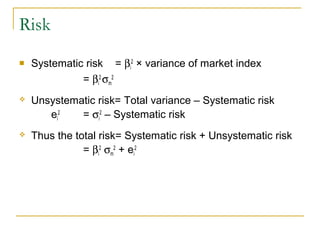
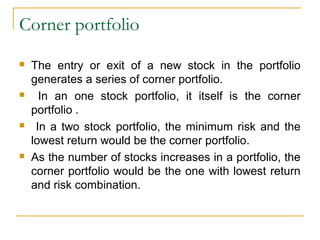
C1 = (10 x .7)/ [ 1 + ( 10 x .05)] =4.67
C2 = (10 x 1.6)/ [ 1 + ( 10 x .125)] =7.11
C3 = (10 x 1.9)/ [ 1 + ( 10 x .15)] =7.6
C4 = (10 x 2.9)/ [ 1 + ( 10 x .25)] = 8.29* Cut-off point
C5 = (10 x 3.3)/ [ 1 + ( 10 x .3)] = 8.25
C6 = (10 x 3.34)/ [ 1 +( 10 x .305)] = 8.25
C7= (10 x 3.79)/ [ 1 + ( 10 x .38)] = 7.90](https://image.slidesharecdn.com/sharpeindexmodel-140104220433-phpapp01/85/Sharpe-index-model-24-320.jpg)

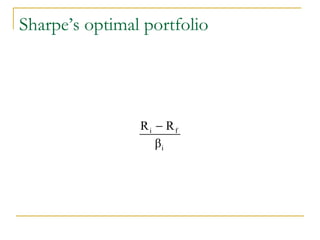
![Construction of the optimal portfolio
ÔÅÆ
ÔÅÆ
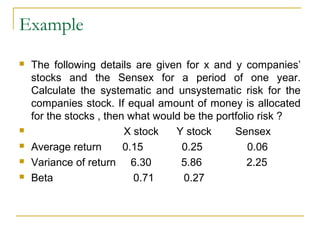
After determining the securities to be
selected, the portfolio manager should find
out how much should be invested in each
security.The percentage of funds to be
invested in each security can be estimated as
follows .
Zi = (βi / σ2ei ) x [ (Ri – Rf / βi) – C ]](https://image.slidesharecdn.com/sharpeindexmodel-140104220433-phpapp01/85/Sharpe-index-model-27-320.jpg)
![ÔÅÆ
ÔÅÆ
ÔÅÆ
ÔÅÆ
ÔÅÆ
ÔÅÆ
ÔÅÆ
ÔÅÆ
ÔÅÆ
ÔÅÆ
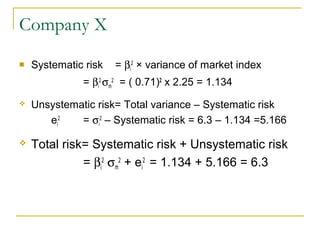
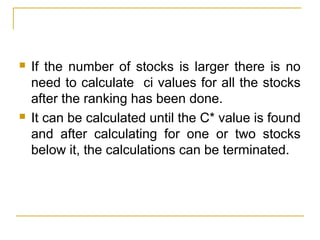
Zi = (βi / σ2ei ) x [ (Ri – Rf / βi) – C ]
Z1 = (1/20) x ( 14 – 8.29)
Z2 = (1.5 / 30) x ( 12 – 8.29)
Z3 = (0.5 / 10) x ( 12 – 8.29)
Z4 = (2 / 40) x ( 10 – 8.29)
Total
X1 = 0.285/ .743 = 0.38
X2 = 0.186 / .743 = 0.25
X3 = 0.186 / .743 = 0.25
X4 = 0.086 / .743 = 0.12
= 0.285
= 0.186
= 0.186
= 0.086
= .743](https://image.slidesharecdn.com/sharpeindexmodel-140104220433-phpapp01/85/Sharpe-index-model-28-320.jpg)

Sharpe index model
- 2. Need for Sharpe Model    In Markowitz model a number of co-variances have to be estimated. If a financial institution buys 150 stocks, it has to estimate 11,175 i.e., (N2 – N)/2 correlation co-efficients. Sharpe assumed that the return of a security is linearly related to a single index like the market index.
- 3. Single Index Model    Casual observation of the stock prices over a period of time reveals that most of the stock prices move with the market index. When the Sensex increases, stock prices also tend to increase and vice – versa. This indicates that some underlying factors affect the market index as well as the stock prices.
- 4. Stock prices are related to the market index and this relationship could be used to estimate the return of stock. Ri = αi + βi Rm + ei where Ri — expected return on security i αi — intercept of the straight line or alpha co-efficient βi — slope of straight line or beta co-efficient Rm — the rate of return on market index ei — error term
- 5. Risk  Systematic risk = βi2 × variance of market index = β i2 σ m 2  Unsystematic risk= Total variance – Systematic risk ei2 = σi2 – Systematic risk  Thus the total risk= Systematic risk + Unsystematic risk = β i2 σ m 2 + e i2
- 6. Portfolio Variance 2  N  2   N 2 2 σ 2 =  ∑ x i β i ÷ σ m  +  ∑ x i e i  p   i =1   i =1   
- 7. where σ2p = variance of portfolio σ2m = expected variance of market index e2i= Unsystematic risk xi = the portion of stock i in the portfolio
- 8. Example      The following details are given for x and y companies’ stocks and the Sensex for a period of one year. Calculate the systematic and unsystematic risk for the companies stock. If equal amount of money is allocated for the stocks , then what would be the portfolio risk ? X stock Y stock Sensex Average return 0.15 0.25 0.06 Variance of return 6.30 5.86 2.25 Βeta 0.71 0.27
- 9. Company X  Systematic risk = βi2 × variance of market index = βi2 σm2 = ( 0.71)2 x 2.25 = 1.134  Unsystematic risk= Total variance – Systematic risk ei2 = σi2 – Systematic risk = 6.3 – 1.134 =5.166  Total risk= Systematic risk + Unsystematic risk = βi2 σm2 + ei2 = 1.134 + 5.166 = 6.3
- 10. Company Y  Systematic risk = βi2 × variance of market index = βi2 σm2 = ( 0.27)2 x 2.25 = 0.1640  Unsystematic risk= Total variance – Systematic risk ei2 = σi2 – Systematic risk = 5.86 – 1.134 =5.166
- 11.     σ2p = [ ( .5 x .71 + .5 x .27)2 2.25 ] + [ ( .5)2 (5.166) + (.5 )2 ( 5.696) ] = [ ( .355 + .135 )2 2.25 ] + [ ( 1.292 + 1.424 ) ] = 0.540 + 2.716 = 3.256
- 12. Corner portfolio ÔÅÆ ÔÅÆ ÔÅÆ ÔÅÆ The entry or exit of a new stock in the portfolio generates a series of corner portfolio. In an one stock portfolio, it itself is the corner portfolio . In a two stock portfolio, the minimum risk and the lowest return would be the corner portfolio. As the number of stocks increases in a portfolio, the corner portfolio would be the one with lowest return and risk combination.
- 13. Expected Return of Portfolio N R p = ∑ x i (αi + βi R m ) i =1
- 14.    For each security αi and βi should be estimated Portfolio return is the weighted average of the estimated return for each security in the portfolio. The weights are the respective stocks’ proportions in the portfolio.
- 15. Portfolio Beta N β p = ∑ x iβ i i =1
- 16. A portfolio’s beta value is the weighted average of the beta values of its component stocks using relative share of them in the portfolio as weights. βp is the portfolio beta.
- 17. Sharpe’s optimal portfolio Ri − Rf βi
- 18.  The selection of any stock is directly related to its excess return to beta ratio.  where Ri = the expected return on stock i Rf = the return on a risk less asset βi = Systematic risk
- 19. Optimal Portfolio  The steps for finding out the stocks to be included in the optimal portfolio are as:    Find out the “excess return to beta” ratio for each stock under consideration Rank them from the highest to the lowest Proceed to calculate Ci for all the stocks according to the ranked order using the following formula
- 20. (R i − R f )βi 2 σ ei i =1 N β2 2 i 1 +σ m ∑ 2 i =1 σ ei 2 m N σ ∑ Ci
- 21. σm2 = variance of the market index σei2 = stock’s unsystematic risk
- 22. Cut-off point   The cumulated values of Ci start declining after a particular Ci and that point is taken as the cut-off point and that stock ratio is the cut-off ratio C. σ ei2 - Unsystematic risk (Ri – Rf) / βi – Excess return to Beta
- 23. Example  Data for finding out the optimal portfolio are given below  Security number Mean return Excess return Beta σ ei2 Ri  Ri – Rf  1 19 14 1.0 20 23 18 1.5 30 12  3 11 6 0.5 10 12  4 25 20 2.0  5 13 8 1.0  6 9 β 14  2 (Ri – Rf) / βi  7  4 0.5 40 20 50 14 10 8 8 9 1.5 30 6 The riskless rate of intrest is 5% and the market variance is 10. Determine the cut – off point .
- 24. ÔÅÆ ÔÅÆ ÔÅÆ ÔÅÆ ÔÅÆ ÔÅÆ ÔÅÆ C1 = (10 x .7)/ [ 1 + ( 10 x .05)] =4.67 C2 = (10 x 1.6)/ [ 1 + ( 10 x .125)] =7.11 C3 = (10 x 1.9)/ [ 1 + ( 10 x .15)] =7.6 C4 = (10 x 2.9)/ [ 1 + ( 10 x .25)] = 8.29* Cut-off point C5 = (10 x 3.3)/ [ 1 + ( 10 x .3)] = 8.25 C6 = (10 x 3.34)/ [ 1 +( 10 x .305)] = 8.25 C7= (10 x 3.79)/ [ 1 + ( 10 x .38)] = 7.90
- 25. ÔÅÆ ÔÅÆ ÔÅÆ ÔÅÆ The highest Ci value is taken as the cut-off point i.e C*. The stocks ranked above C* have high excess returns to beta than the cut off Ci and all the stocks ranked below C* have low excess return to beta. Here the cut off rate is 8.29. Hence the first four securities are selected.
- 26. ÔÅÆ ÔÅÆ If the number of stocks is larger there is no need to calculate ci values for all the stocks after the ranking has been done. It can be calculated until the C* value is found and after calculating for one or two stocks below it, the calculations can be terminated.
- 27. Construction of the optimal portfolio   After determining the securities to be selected, the portfolio manager should find out how much should be invested in each security.The percentage of funds to be invested in each security can be estimated as follows . Zi = (βi / σ2ei ) x [ (Ri – Rf / βi) – C ]
- 28.           Zi = (βi / σ2ei ) x [ (Ri – Rf / βi) – C ] Z1 = (1/20) x ( 14 – 8.29) Z2 = (1.5 / 30) x ( 12 – 8.29) Z3 = (0.5 / 10) x ( 12 – 8.29) Z4 = (2 / 40) x ( 10 – 8.29) Total X1 = 0.285/ .743 = 0.38 X2 = 0.186 / .743 = 0.25 X3 = 0.186 / .743 = 0.25 X4 = 0.086 / .743 = 0.12 = 0.285 = 0.186 = 0.186 = 0.086 = .743
- 29. ÔÅÆ ÔÅÆ ÔÅÆ So the largest investment should be made in security 1 ( 0.38%) and the smallest in security 4 ( 0.12%). The characteristics of a stock that make it desirable can be determined before the calculations of an optimal portfolio is begun. The desirability of any stock is solely a function of its excess return to beta ratio.