Six Sigma Project-Iverson
- 1. Six Sigma Project Overview Final Report Mack Operations Focus Duration of Project: May ~ July 2004 Craig Lester Continuous Improvement Manager Iverson Industries Inc.
- 2. DEFINE Team Members TEAM LEADER Craig Lester – Continuous Improvement Manager TEAM MEMBERS *Michael Iverson - Engineering Manager *Bill D. - Maintenance Supervisor Cross Functional Core Team *Jim T. - Process Engineer *Wayne R. / Brenda P. - Quality Engineer *Jim A. / Ali A. - Production Supervisor *Manufacturing Associates
- 3. DEFINE Define Problem Statement The Mack operation is not meeting Customer Demand for Delivery and Quality. Labor costs are excessive due to Overtime consumption. The Mack operation is NOT Balanced Labor is @ 150% of the quoted level Delivery is below forecast levels +/- 89%. Customer Quality is unsatisfactory – Repeat Rejections Changeovers are Lengthy and Costly Project Goals Reduce labor costs by 25% Improve OEE ratings by 25% Improve Line Balance Eliminate Customer Defects Reduce Internal Quality rejects Achieve Production Yield Goals SMED for Changeover Reduction
- 4. MEASURE Op 10 AB - Process Measure Mack Job #2800 - Monthly Production Averages Op 10AB 18 16.9 16.4 16.116.5 16.5 16.5 16 14.4 14 14 12 10 8 % G o a f l 6 4 H A P d u o p g c e s a v r t . 2 0 April May June July Month Monthly Avg. Goal
- 5. MEASURE Op 10 CD - Process Measure Mack Job #2800 - Monthly Production Averages Op 10CD 18 16 16 14.7 14.9 14.8 15 15 14 12.6 12.5 12 10 8 % G o a f l 6 4 H A P d u o p g c e s a v r t . 2 0 April May June July Month Monthly Avg. Goal
- 6. MEASURE Op 20 AB - Process Measure Mack Job #2800 - Monthly Production Averages Op 20AB - 2 Operators 30 25.6 25 21 20 18.8 18.9 19 19 18 18 15 % G o a f l 10 H A P d u o p g c e s a v r t . 5 0 April May June July Month Monthly Avg. Goal
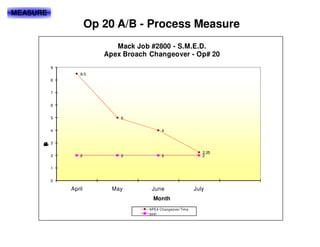
- 7. MEASURE Op 20 A/B - Process Measure Mack Job #2800 - S.M.E.D. Apex Broach Changeover - Op# 20 9 8.5 8 7 6 5 5 4 4 3 m C T o g n h v e a r i 2.25 2 2 2 2 2 1 0 April May June July Month APEX Changeover Tim e goal
- 8. MEASURE Op 30 / 40 - Process Measure Mack Job #2800 - Monthly Production Averages Op 30 Drill - Op40 Shape 20 18.8 18.9 18.0 19 19 18 18 18 16 14 14 12 10 % G o a 8 f l 6 4 H A P d u o p g c e s a v r t . 2 0 April May June July Month Monthly Avg. Goal
- 9. ANALYZE Analysis – Downtime and Scrap
- 10. ANALYZE Job #2800 – P/N 30KH430 Iverson Ind. Production Control Wapauca Weekly/Monthly Foundry. Daily Update – Release Email Days - Weekly Schedule Arvin Meritor Lead Daily Ship Schedule and Chg. Over Chg. Over Chg. Over Chg. Over Rough Turn – Op Finish Turn – Op 10C,D Slot Broach Op 20 Drill Op 30 10A,B Shape Op 40 Bulk Storage Cut Time (incl. Load) = Cut Time (incl. Load) = Cut Time (incl. Load) = Cut Time (incl. Load). = 150 sec 157 sec. 191 sec. 60 sec. Chg./O Time = 30 Chg./O Time = 30 Chg./O Time = 1hr Chg./O Time = 1hr – 4 hr min. min. – 4 hr Avg. Uptime = Avg. Uptime = Avg. Downtime = Avg. Uptime = Final Insp. Shipping 2 - 10 hr Shifts 2 – 10 hr Shifts 2 – 10hr Shifts 2 – 10hr Shifts 1 pc / pallet 127 100 191 70 40 90 120 90 sec sec sec sec sec sec sec sec 30 30 30 30 20 30 30 sec sec sec sec sec sec sec
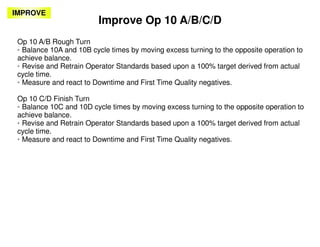
- 11. IMPROVE Improve Op 10 A/B/C/D Op 10 A/B Rough Turn Balance 10A and 10B cycle times by moving excess turning to the opposite operation to achieve balance. Revise and Retrain Operator Standards based upon a 100% target derived from actual cycle time. Measure and react to Downtime and First Time Quality negatives. Op 10 C/D Finish Turn Balance 10C and 10D cycle times by moving excess turning to the opposite operation to achieve balance. Revise and Retrain Operator Standards based upon a 100% target derived from actual cycle time. Measure and react to Downtime and First Time Quality negatives.
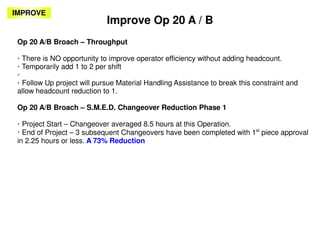
- 12. IMPROVE Improve Op 20 A / B Op 20 A/B Broach – Throughput There is NO opportunity to improve operator efficiency without adding headcount. Temporarily add 1 to 2 per shift Follow Up project will pursue Material Handling Assistance to break this constraint and allow headcount reduction to 1. Op 20 A/B Broach – S.M.E.D. Changeover Reduction Phase 1 Project Start – Changeover averaged 8.5 hours at this Operation. End of Project – 3 subsequent Changeovers have been completed with 1st piece approval in 2.25 hours or less. A 73% Reduction
- 13. IMPROVE Improve Op 30 Drill / Op 40 Shape Op 30 Drill / Op 40 Shape Throughput increased from 14 parts per hour to 18.8 parts per hour. A 34% Improvement Rewrite the program for the Mitsubishi Shaper to reduce Constraint cycle time. Completed w/ 50% Reduction. Op 30 Drill / Op 40 Shape – S.M.E.D. Changeover Reduction Phase 1 Project Start – Changeover averaged 3.6 hours at this Operation. End of Project – 2 subsequent Changeovers have been completed with 1st piece approval in 1.5 hours or less. A 42% Reduction Op 30 Drill / Op 40 Shape – Setup Scrap Reduction Phase 1 Project Start – Changeover averaged 3 pieces at setup at this Operation. End of Project – 2 subsequent Changeovers have been completed with 1st piece approval on the first part (Zero setup scrap).
- 14. CONTROL Control – Control Plans, LPA's • Control Plans –The Mack Control Plans have been thoroughly reviewed and scrutinized in conjunction with PFMEA and Customer Feedback. All revisions have been completed through document control. Each Corrective Action (Internal / External) requires C.P. / PFMEA review. • Layered Process Audits Layered Audits are utilized to determine if Controls are adequate. Layered Audits are supported and driven by Executive Management Monthly Compliance Report - Layered Process Audit 120.0% 100.0% LPA 80.0% Implementation G o a 60.0% l 90.9% 96.3% 95.7% 89.2% 87.4% 40.0% 20.0% 0.0% 0.0% 0.0% 0.0% 0.0% 0.0% 0.0% m % C A 0.0% p h n o y a e s t f l ' JAN FEB MAR APR MAY JUNE JUL AUG SEP OCT NOV DEC % OF C OMPLIAN C E: Goal Mack Truck
- 15. CONTROL Control – Management Review • Management Review –The Mack project has been driven by weekly Management Review and Action Assignment Sessions. Example
- 16. Project Summary • Problem –The Mack operation is not performing @ acceptable cost and / or performance levels. • Analysis and Solution – The Mack Line as a whole is not well balanced. Individual Operations are also imbalanced creating NVA wait time. Post and Coach updated Targets for maximum throughput. Re-Balance each operation to improve flow and throughput Re-write machine programs to reduce cycle time and eliminate dead air time with the tools. • Results and Business Benefit(s) – Op 10 A/B increased throughput 2.5 parts per hour or 17% _ Op 10 C/D increased throughput 2.3 parts per hour or 18% _ Op 20A/B – Decreased Changeover time by 73% (6.25 hours) _ Op 30 / 40 increased throughput by 4.9 parts per hour or 35%
- 17. PROJECT SCORECARD Productivity Improvement Report Mack Line - Job # 2800 - P/N - 30KH 430 Parts Per Hour PPH April May June July August Change ∆ 10 AB Rough Turn 14.4 16.1 16.9 16.9 16.8 2.5 17.4% 10 CD Finish Turn 12.6 14.7 14.9 14.8 14.8 2.3 18.3% 20 AB Slot Broach 21 25.6 18.8 18.9 21 20 AB 3 Oper.s 44.0 44.0 44.0 44.0 30 Drill 14 18.0 18.8 18.9 19 4.9 35.0% 40 Shape 14.0 18.0 18.8 18.9 18.8 4.9 35.0% APEX Changeover Time 8.5 5 5 3.5 2.25 -6.25 -73.5% (Stick & Fixtures)


