Sonic IR Imaging on Bell Composite Panels
Download as PPTX, PDF0 likes337 views

This document summarizes experiments conducted using sonic IR imaging on bell impact panels. Various experimental settings were tested, including frequency, coupling material, and tip size. Tests were done on hat and I-beam panels to observe vibration behavior and identify optimal settings. Experiments analyzed panel vibration both width-wise and length-wise. Consistency of vibration mode patterns was also evaluated through repeated tests.


Sonic IR Imaging on Bell Composite Panels
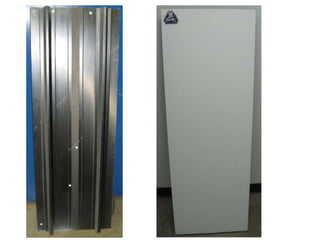
- 1. Sonic IR Imaging on Bell Imact Panels (Hat and I-Beam) By: Justin Ar-Rasheed
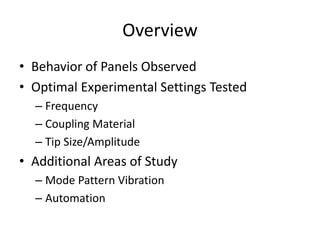
- 2. Overview ? Behavior of Panels Observed ? Optimal Experimental Settings Tested ©C Frequency ©C Coupling Material ©C Tip Size/Amplitude ? Additional Areas of Study ©C Mode Pattern Vibration ©C Automation
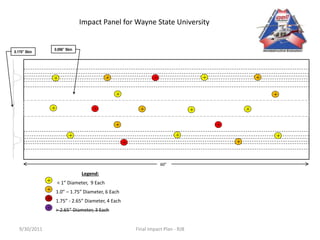
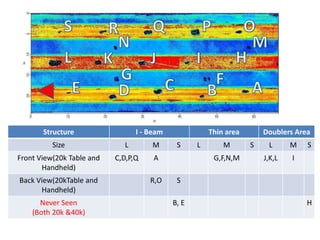
- 4. Legend: < 1Ī▒ Diameter, 9 Each 1.0Ī▒ ©C 1.75Ī▒ Diameter, 6 Each 1.75Ī▒ - 2.65Ī▒ Diameter, 4 Each > 2.65Ī▒ Diameter, 3 Each 0.170Ī▒ Skin 0.096Ī▒ Skin Impact Panel for Wayne State University 60Ī▒ 9/30/2011 Final Impact Plan - RJB
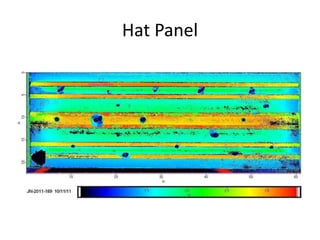
- 5. Hat Panel
- 6. Test Experiments ? Shoot gun on various locations of panel ? Analyze results and come up with hypothesis
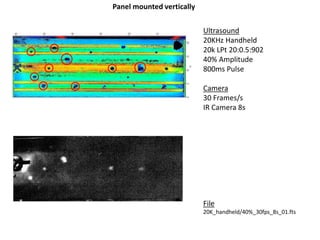
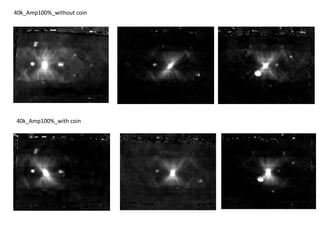
- 7. Ultrasound 20KHz Handheld 20k LPt 20:0.5:902 40% Amplitude 800ms Pulse Camera 30 Frames/s IR Camera 8s File 20K_handheld/40%_30fps_8s_01.fts Panel mounted vertically
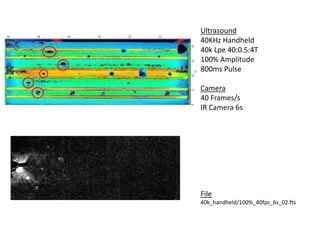
- 8. Ultrasound 40KHz Handheld 40k Lpe 40:0.5:4T 100% Amplitude 800ms Pulse Camera 40 Frames/s IR Camera 6s File 40k_handheld/100%_40fps_6s_02.fts
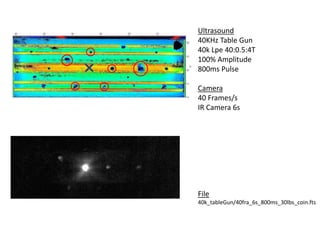
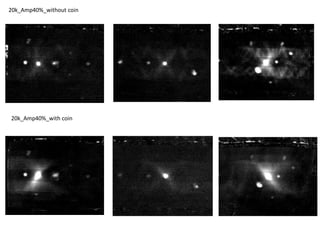
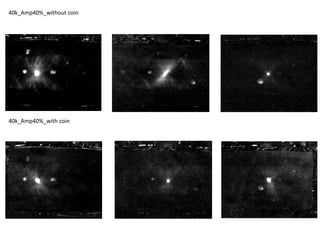
- 9. Ultrasound 40KHz Table Gun 40k Lpe 40:0.5:4T 100% Amplitude 800ms Pulse Camera 40 Frames/s IR Camera 6s File 40k_tableGun/40fra_6s_800ms_30lbs_coin.fts
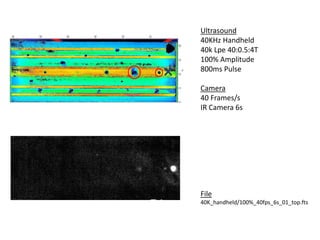
- 10. Ultrasound 40KHz Handheld 40k Lpe 40:0.5:4T 100% Amplitude 800ms Pulse Camera 40 Frames/s IR Camera 6s File 40K_handheld/100%_40fps_6s_01_top.fts
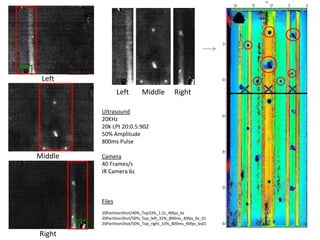
- 11. Ultrasound 20KHz 20k LPt 20:0.5:902 50% Amplitude 800ms Pulse Camera 40 Frames/s IR Camera 6s Files 20PartitionShot/40%_Top33%_1.2s_40fps_6s 20PartitionShot/50%_Top_left_33%_800ms_40fps_6s_01 20PartitionShot/50%_Top_right_33%_800ms_40fps_6s01 Left Middle Right Left Middle Right
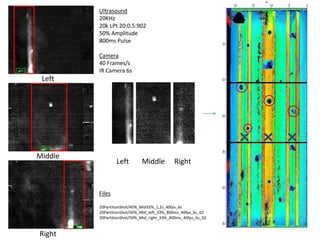
- 12. Ultrasound 20KHz 20k LPt 20:0.5:902 50% Amplitude 800ms Pulse Camera 40 Frames/s IR Camera 6s Files 20PartitionShot/40%_Mid33%_1.2s_40fps_6s 20PartitionShot/50%_Mid_left_33%_800ms_40fps_6s_02 20PartitionShot/50%_Mid_right_33%_800ms_40fps_6s_02 Left Middle Right Left Middle Right
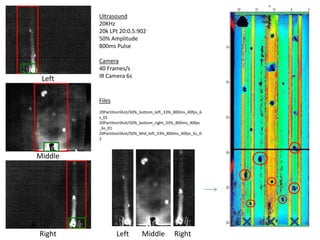
- 13. Ultrasound 20KHz 20k LPt 20:0.5:902 50% Amplitude 800ms Pulse Camera 40 Frames/s IR Camera 6s Files 20PartitionShot/50%_bottom_left_33%_800ms_40fps_6 s_01 20PartitionShot/50%_bottom_right_33%_800ms_40fps _6s_01 20PartitionShot/50%_Mid_left_33%_800ms_40fps_6s_0 2 Left Middle Right Left Middle Right
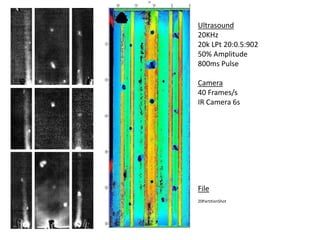
- 14. Ultrasound 20KHz 20k LPt 20:0.5:902 50% Amplitude 800ms Pulse Camera 40 Frames/s IR Camera 6s File 20PartitionShot
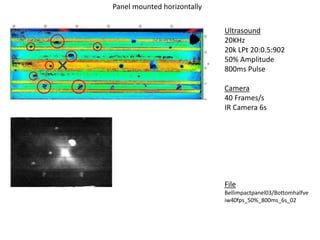
- 15. Ultrasound 20KHz 20k LPt 20:0.5:902 50% Amplitude 800ms Pulse Camera 40 Frames/s IR Camera 6s File Bellimpactpanel03/Bottomhalfve iw40fps_50%_800ms_6s_02 Panel mounted horizontally
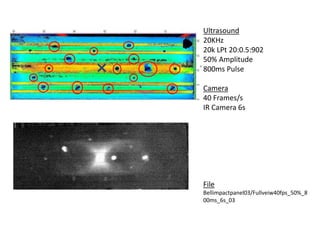
- 16. Ultrasound 20KHz 20k LPt 20:0.5:902 50% Amplitude 800ms Pulse Camera 40 Frames/s IR Camera 6s File Bellimpactpanel03/Fullveiw40fps_50%_8 00ms_6s_03
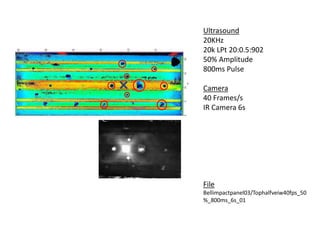
- 17. Ultrasound 20KHz 20k LPt 20:0.5:902 50% Amplitude 800ms Pulse Camera 40 Frames/s IR Camera 6s File Bellimpactpanel03/Tophalfveiw40fps_50 %_800ms_6s_01
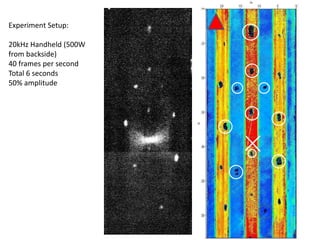
- 18. Experiment Setup: 20kHz Handheld (500W from backside) 40 frames per second Total 6 seconds 50% amplitude
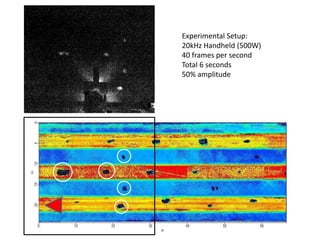
- 19. Experimental Setup: 20kHz Handheld (500W) 40 frames per second Total 6 seconds 50% amplitude
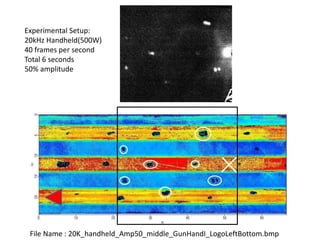
- 20. Experimental Setup: 20kHz Handheld(500W) 40 frames per second Total 6 seconds 50% amplitude File Name : 20K_handheld_Amp50_middle_GunHandI_LogoLeftBottom.bmp
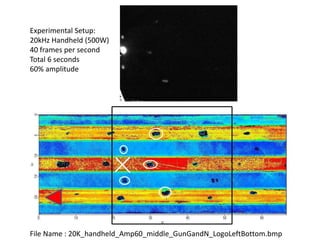
- 21. Experimental Setup: 20kHz Handheld (500W) 40 frames per second Total 6 seconds 60% amplitude File Name : 20K_handheld_Amp60_middle_GunGandN_LogoLeftBottom.bmp
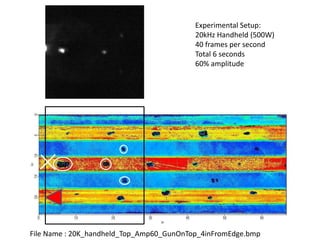
- 22. Experimental Setup: 20kHz Handheld (500W) 40 frames per second Total 6 seconds 60% amplitude File Name : 20K_handheld_Top_Amp60_GunOnTop_4inFromEdge.bmp
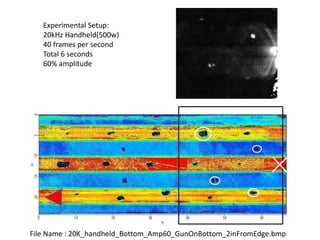
- 23. Experimental Setup: 20kHz Handheld(500w) 40 frames per second Total 6 seconds 60% amplitude File Name : 20K_handheld_Bottom_Amp60_GunOnBottom_2inFromEdge.bmp
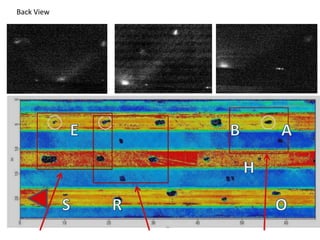
- 25. Back View
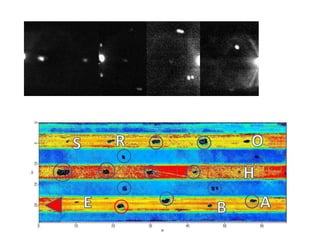
- 26. Structure I - Beam Thin area Doublers Area Size L M S L M S L M S Front View(20k Table and Handheld) C,D,P,Q A G,F,N,M J,K,L I Back View(20kTable and Handheld) R,O S Never Seen (Both 20k &40k) B, E H
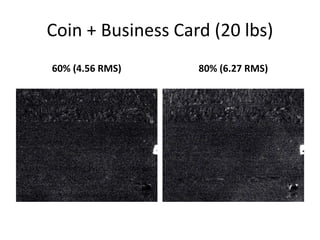
- 32. Small Tip Experiment Coupling Materials and Tips
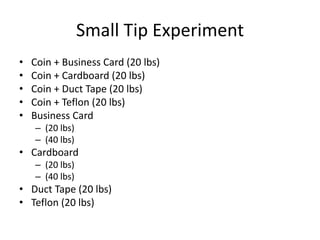
- 33. Small Tip Experiment ? Coin + Business Card (20 lbs) ? Coin + Cardboard (20 lbs) ? Coin + Duct Tape (20 lbs) ? Coin + Teflon (20 lbs) ? Business Card ©C (20 lbs) ©C (40 lbs) ? Cardboard ©C (20 lbs) ©C (40 lbs) ? Duct Tape (20 lbs) ? Teflon (20 lbs)
- 34. Coin + Business Card (20 lbs) 60% (4.56 RMS) 80% (6.27 RMS)
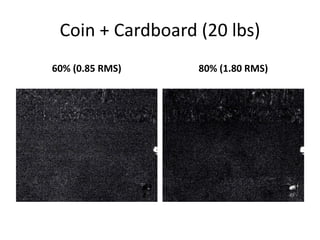
- 35. Coin + Cardboard (20 lbs) 60% (0.85 RMS) 80% (1.80 RMS)
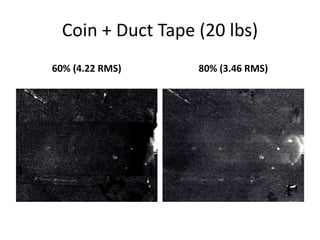
- 36. Coin + Duct Tape (20 lbs) 60% (4.22 RMS) 80% (3.46 RMS)
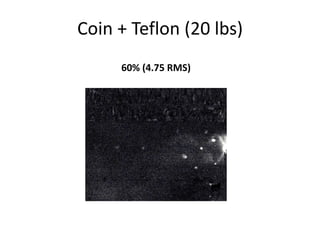
- 37. Coin + Teflon (20 lbs) 60% (4.75 RMS)
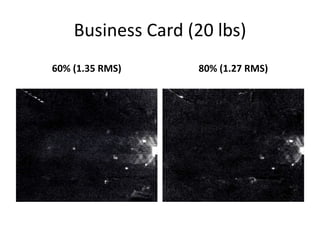
- 38. Business Card (20 lbs) 60% (1.35 RMS) 80% (1.27 RMS)
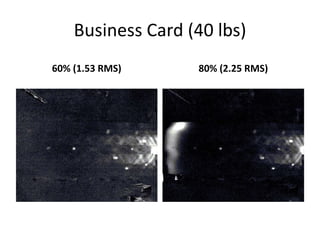
- 39. Business Card (40 lbs) 60% (1.53 RMS) 80% (2.25 RMS)
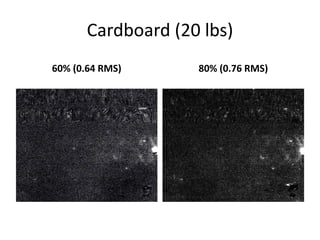
- 40. Cardboard (20 lbs) 60% (0.64 RMS) 80% (0.76 RMS)
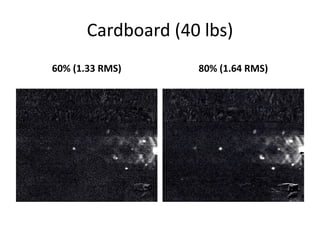
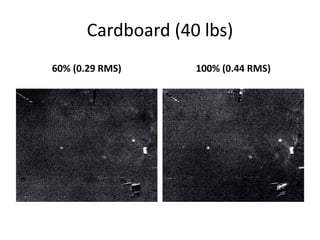
- 41. Cardboard (40 lbs) 60% (1.33 RMS) 80% (1.64 RMS)
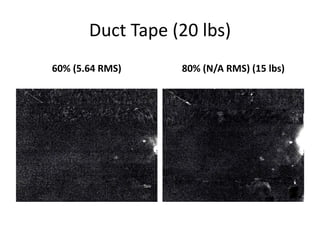
- 42. Duct Tape (20 lbs) 60% (5.64 RMS) 80% (N/A RMS) (15 lbs)
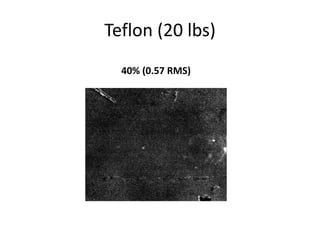
- 43. Teflon (20 lbs) 40% (0.57 RMS)
- 44. Medium Tip Experiment Coupling Materials and Tips
- 45. Medium Tip Experiment ? Coin + Duct Tape (40 lbs) ? Coin + Duct Tape (60 lbs) ? Coin + Teflon (40 lbs) ? Coin + Teflon (20 lbs) ? Business Card (40 lbs) ? Cardboard (40 lbs) ? Duct Tape (40 lbs)
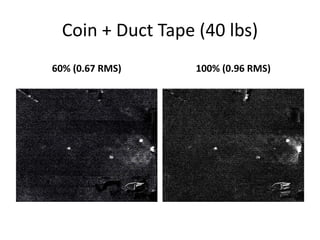
- 46. Coin + Duct Tape (40 lbs) 60% (0.67 RMS) 100% (0.96 RMS)
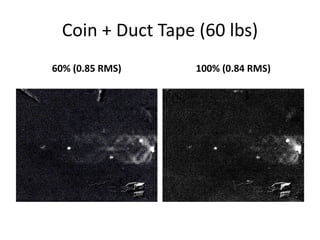
- 47. Coin + Duct Tape (60 lbs) 60% (0.85 RMS) 100% (0.84 RMS)
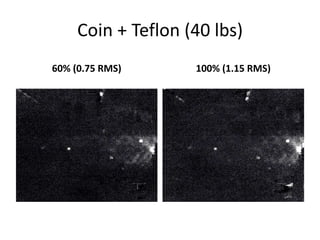
- 48. Coin + Teflon (40 lbs) 60% (0.75 RMS) 100% (1.15 RMS)
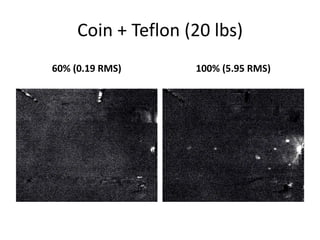
- 49. Coin + Teflon (20 lbs) 60% (0.19 RMS) 100% (5.95 RMS)
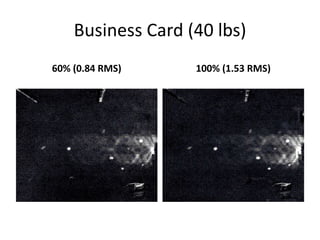
- 50. Business Card (40 lbs) 60% (0.84 RMS) 100% (1.53 RMS)
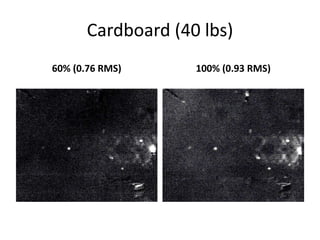
- 51. Cardboard (40 lbs) 60% (0.76 RMS) 100% (0.93 RMS)
- 52. Large Tip Experiment Coupling Materials and Tips
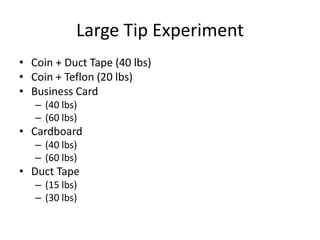
- 53. Large Tip Experiment ? Coin + Duct Tape (40 lbs) ? Coin + Teflon (20 lbs) ? Business Card ©C (40 lbs) ©C (60 lbs) ? Cardboard ©C (40 lbs) ©C (60 lbs) ? Duct Tape ©C (15 lbs) ©C (30 lbs)
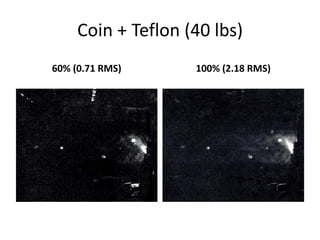
- 54. Coin + Teflon (40 lbs) 60% (0.71 RMS) 100% (2.18 RMS)
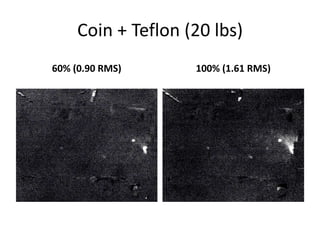
- 55. Coin + Teflon (20 lbs) 60% (0.90 RMS) 100% (1.61 RMS)
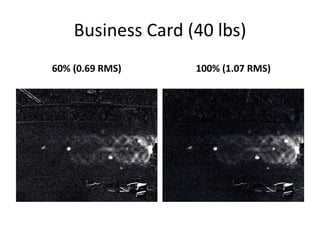
- 56. Business Card (40 lbs) 60% (0.69 RMS) 100% (1.07 RMS)
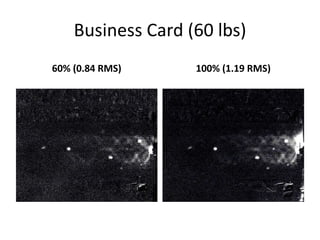
- 57. Business Card (60 lbs) 60% (0.84 RMS) 100% (1.19 RMS)
- 58. Cardboard (40 lbs) 60% (0.29 RMS) 100% (0.44 RMS)
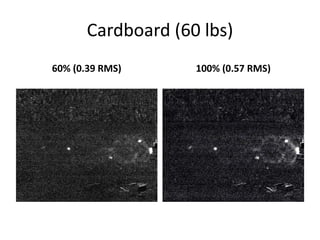
- 59. Cardboard (60 lbs) 60% (0.39 RMS) 100% (0.57 RMS)
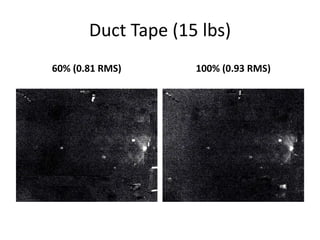
- 60. Duct Tape (15 lbs) 60% (0.81 RMS) 100% (0.93 RMS)
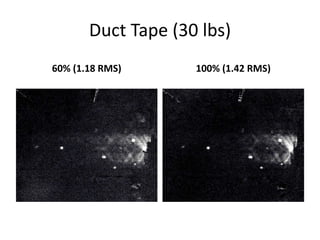
- 61. Duct Tape (30 lbs) 60% (1.18 RMS) 100% (1.42 RMS)
- 62. Best Coupling Materials Setup 1. Business Card with Large tip 2. Cardboard with Large tip
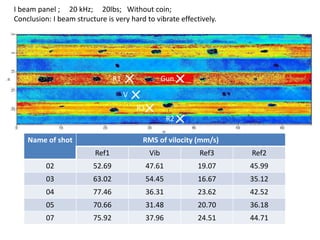
- 64. I beam panel ; 20 kHz; 20lbs; Without coin; Conclusion: I beam structure is very hard to vibrate effectively. R1 Gun V R3 R2 Name of shot RMS of vilocity (mm/s) Ref1 Vib Ref3 Ref2 02 52.69 47.61 19.07 45.99 03 63.02 54.45 16.67 35.12 04 77.46 36.31 23.62 42.52 05 70.66 31.48 20.70 36.18 07 75.92 37.96 24.51 44.71
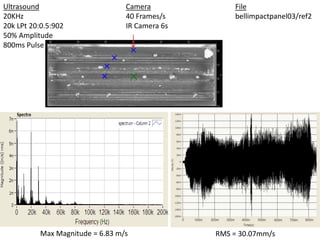
- 65. Ultrasound 20KHz 20k LPt 20:0.5:902 50% Amplitude 800ms Pulse Camera 40 Frames/s IR Camera 6s File bellimpactpanel03/ref2 Max Magnitude = 6.83 m/s RMS = 30.07mm/s
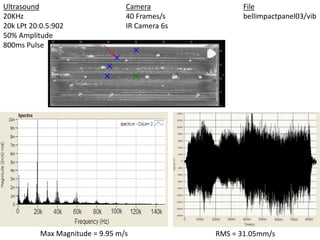
- 66. Ultrasound 20KHz 20k LPt 20:0.5:902 50% Amplitude 800ms Pulse Camera 40 Frames/s IR Camera 6s File bellimpactpanel03/vib Max Magnitude = 9.95 m/s RMS = 31.05mm/s
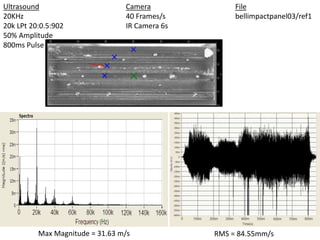
- 67. Ultrasound 20KHz 20k LPt 20:0.5:902 50% Amplitude 800ms Pulse Camera 40 Frames/s IR Camera 6s File bellimpactpanel03/ref1 Max Magnitude = 31.63 m/s RMS = 84.55mm/s
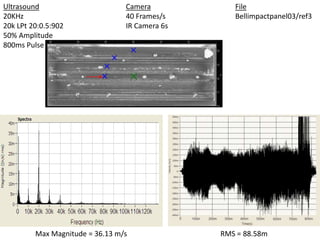
- 68. Ultrasound 20KHz 20k LPt 20:0.5:902 50% Amplitude 800ms Pulse Camera 40 Frames/s IR Camera 6s File Bellimpactpanel03/ref3 Max Magnitude = 36.13 m/s RMS = 88.58m
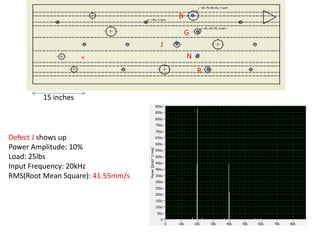
- 69. 15 inches J G N R B Defect J shows up Power Amplitude: 10% Load: 25lbs Input Frequency: 20kHz RMS(Root Mean Square): 41.55mm/s
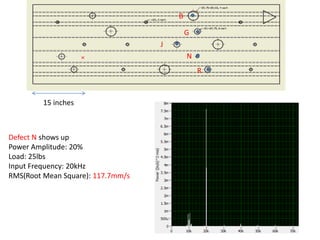
- 70. 15 inches Defect N shows up Power Amplitude: 20% Load: 25lbs Input Frequency: 20kHz RMS(Root Mean Square): 117.7mm/s J G N R B
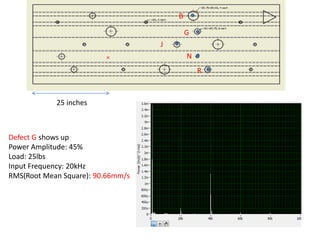
- 71. 25 inches Defect G shows up Power Amplitude: 45% Load: 25lbs Input Frequency: 20kHz RMS(Root Mean Square): 90.66mm/s J G N R B
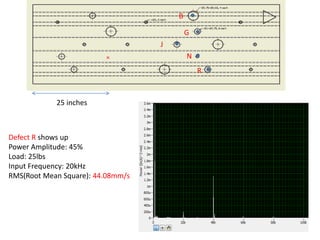
- 72. 25 inches Defect R shows up Power Amplitude: 45% Load: 25lbs Input Frequency: 20kHz RMS(Root Mean Square): 44.08mm/s J G N R B
- 73. 30 inches Defect B shows up Power Amplitude: 35% Load: 25lbs Input Frequency: 20kHz RMS(Root Mean Square): 53.73mm/s J G N R B
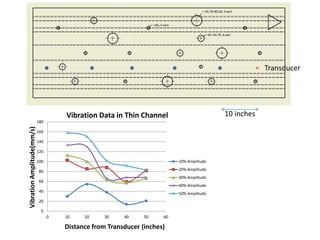
- 75. 10 inches 180 160 140 120 100 80 60 40 20 0 Vibration Data in Thin Channel 0 10 20 30 40 50 60 Vibration Amplitude(mm/s) Distance from Transducer (inches) 10% Amplitude 20% Amplitude 30% Amplitude 40% Amplitude 50% Amplitude Transducer
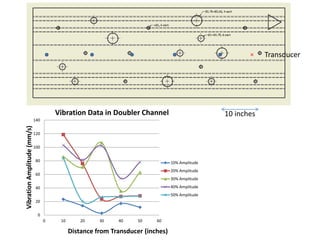
- 76. 10 inches Transducer 140 120 100 80 60 40 20 0 Vibration Data in Doubler Channel 0 10 20 30 40 50 60 Vibration Amplitude (mm/s) Distance from Transducer (inches) 10% Amplitude 20% Amplitude 30% Amplitude 40% Amplitude 50% Amplitude
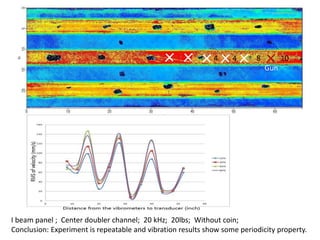
- 77. 4 4 8 10 Gun I beam panel ; Center doubler channel; 20 kHz; 20lbs; Without coin; Conclusion: Experiment is repeatable and vibration results show some periodicity property.
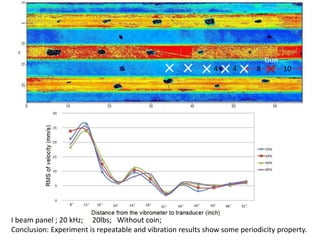
- 78. Gun 4 4 8 10 I beam panel ; 20 kHz; 20lbs; Without coin; Conclusion: Experiment is repeatable and vibration results show some periodicity property.
- 79. Hat Pattern Consistency Test (Vibration Study)
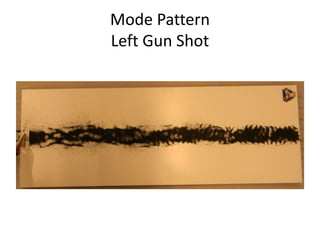
- 80. Mode Pattern Left Gun Shot
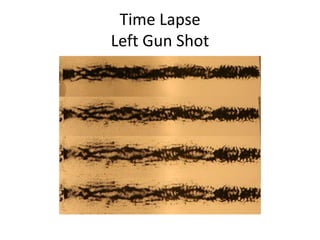
- 81. Time Lapse Left Gun Shot
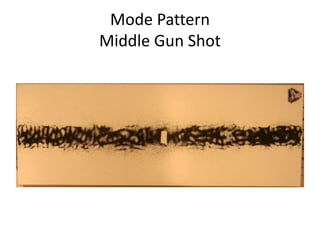
- 82. Mode Pattern Middle Gun Shot
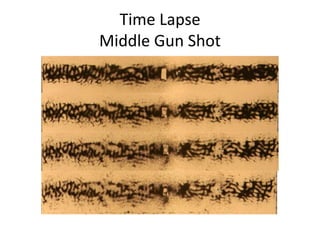
- 83. Time Lapse Middle Gun Shot
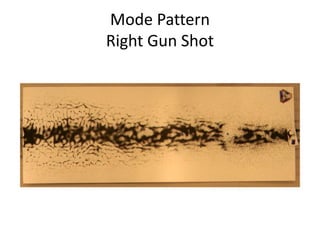
- 84. Mode Pattern Right Gun Shot
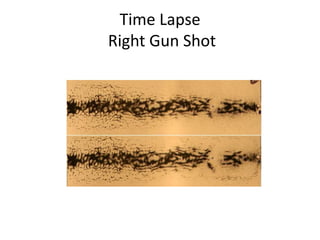
- 85. Time Lapse Right Gun Shot
- 86. Video
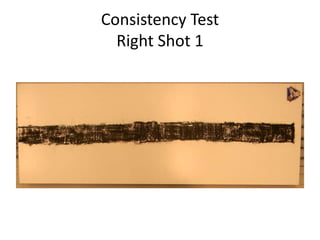
- 87. Consistency Test Right Shot 1
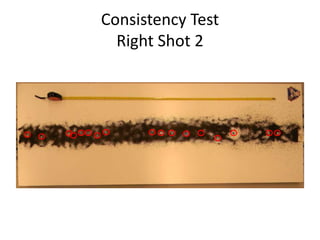
- 88. Consistency Test Right Shot 2
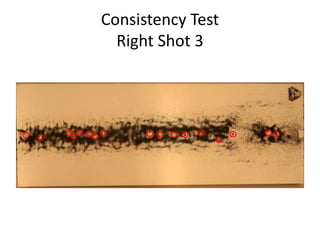
- 89. Consistency Test Right Shot 3
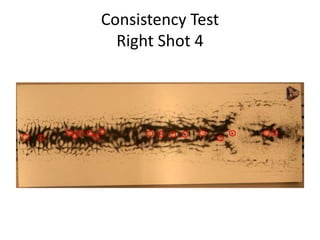
- 90. Consistency Test Right Shot 4
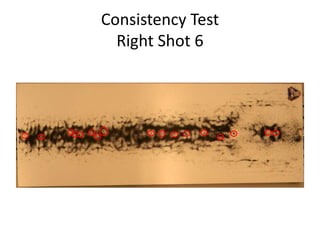
- 91. Consistency Test Right Shot 6
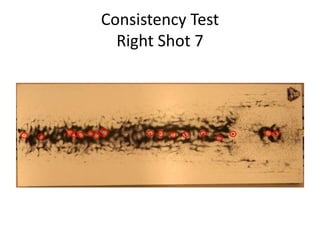
- 92. Consistency Test Right Shot 7
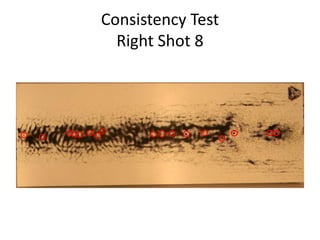
- 93. Consistency Test Right Shot 8
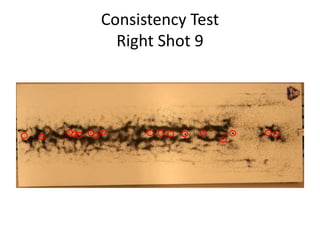
- 94. Consistency Test Right Shot 9
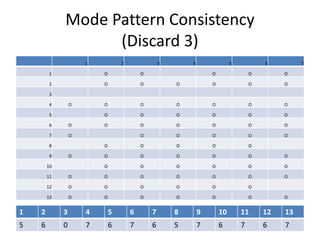
- 95. Mode Pattern Consistency (Discard 3) 1 2 3 4 5 6 7 1 O O O O O 2 O O O O O O 3 4 O O O O O O O 5 O O O O O O 6 O O O O O O O 7 O O O O O O 8 O O O O O 9 O O O O O O O 10 O O O O O O 11 O O O O O O O 12 O O O O O O 13 O O O O O O O 1 2 3 4 5 6 7 8 9 10 11 12 13 5 6 0 7 6 7 6 5 7 6 7 6 7
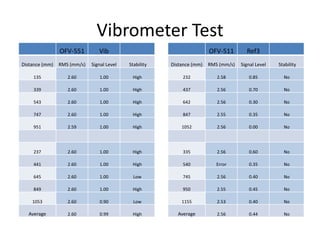
- 97. Vibrometer Test OFV-551 Vib Distance (mm) RMS (mm/s) Signal Level Stability 135 2.60 1.00 High 339 2.60 1.00 High 543 2.60 1.00 High 747 2.60 1.00 High 951 2.59 1.00 High 237 2.60 1.00 High 441 2.60 1.00 High 645 2.60 1.00 Low 849 2.60 1.00 High 1053 2.60 0.90 Low Average 2.60 0.99 High OFV-511 Ref3 Distance (mm) RMS (mm/s) Signal Level Stability 232 2.58 0.85 No 437 2.56 0.70 No 642 2.56 0.30 No 847 2.55 0.35 No 1052 2.56 0.00 No 335 2.56 0.60 No 540 Error 0.35 No 745 2.56 0.40 No 950 2.55 0.45 No 1155 2.53 0.40 No Average 2.56 0.44 No
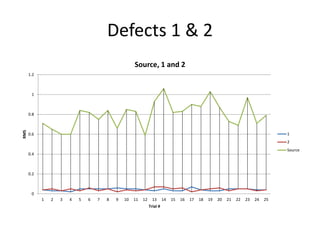
- 98. Defects 1 & 2 1.2 1 0.8 0.6 0.4 0.2 0 Source, 1 and 2 1 2 3 4 5 6 7 8 9 10 11 12 13 14 15 16 17 18 19 20 21 22 23 24 25 RMS Trial # 1 2 Source
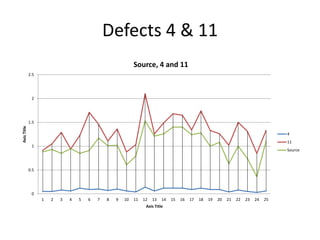
- 99. Defects 4 & 11 2.5 2 1.5 1 0.5 0 Source, 4 and 11 1 2 3 4 5 6 7 8 9 10 11 12 13 14 15 16 17 18 19 20 21 22 23 24 25 Axis Title Axis Title 4 11 Source
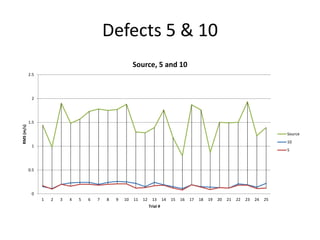
- 100. Defects 5 & 10 2.5 2 1.5 1 0.5 0 Source, 5 and 10 1 2 3 4 5 6 7 8 9 10 11 12 13 14 15 16 17 18 19 20 21 22 23 24 25 RMS (m/s) Trial # Source 10 5
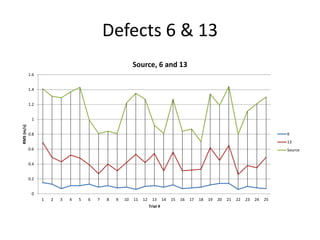
- 101. Defects 6 & 13 1.6 1.4 1.2 1 0.8 0.6 0.4 0.2 0 Source, 6 and 13 1 2 3 4 5 6 7 8 9 10 11 12 13 14 15 16 17 18 19 20 21 22 23 24 25 RMS (m/s) Trial # 6 13 Source
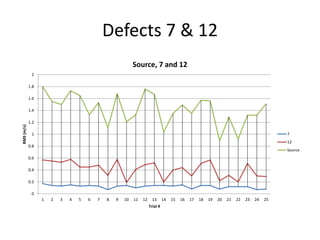
- 102. Defects 7 & 12 2 1.8 1.6 1.4 1.2 1 0.8 0.6 0.4 0.2 0 Source, 7 and 12 1 2 3 4 5 6 7 8 9 10 11 12 13 14 15 16 17 18 19 20 21 22 23 24 25 RMS (m/s) Trial # 7 12 Source
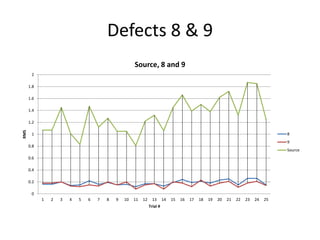
- 103. Defects 8 & 9 2 1.8 1.6 1.4 1.2 1 0.8 0.6 0.4 0.2 0 Source, 8 and 9 1 2 3 4 5 6 7 8 9 10 11 12 13 14 15 16 17 18 19 20 21 22 23 24 25 RMS Trial # 8 9 Source
- 104. New Approach ? Fixed Camera ? Enables Image Processing
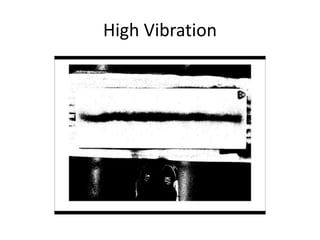
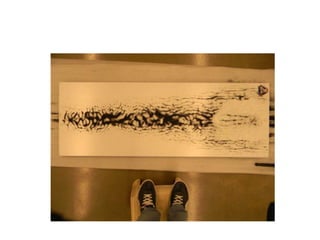
- 105. High Vibration
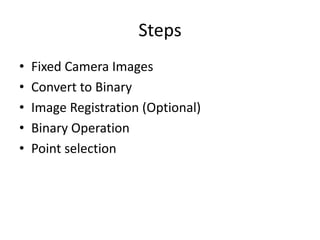
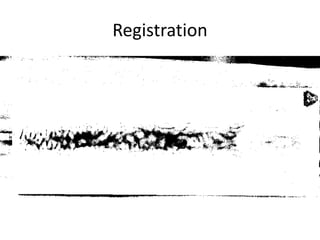
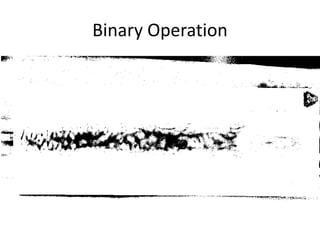
- 106. Steps ? Fixed Camera Images ? Convert to Binary ? Image Registration (Optional) ? Binary Operation ? Point selection
- 108. Registration
- 109. Binary Operation
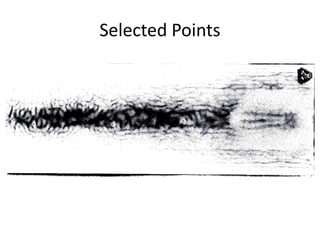
- 110. Selected Points
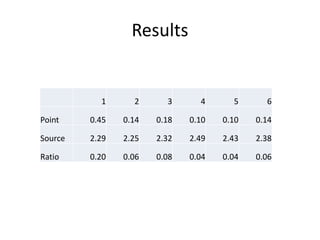
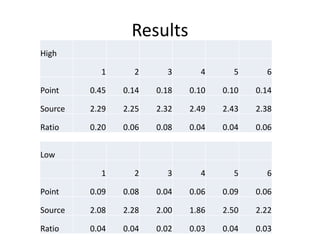
- 111. Results 1 2 3 4 5 6 Point 0.45 0.14 0.18 0.10 0.10 0.14 Source 2.29 2.25 2.32 2.49 2.43 2.38 Ratio 0.20 0.06 0.08 0.04 0.04 0.06
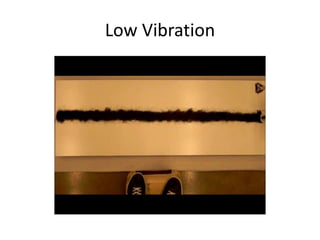
- 112. Low Vibration
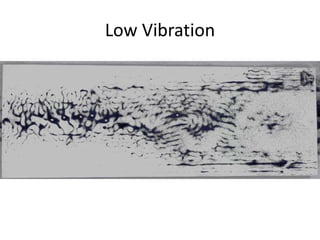
- 113. Low Vibration
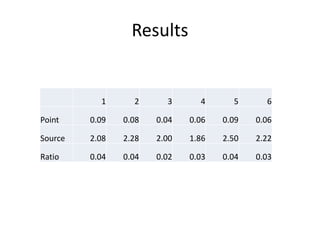
- 114. Results 1 2 3 4 5 6 Point 0.09 0.08 0.04 0.06 0.09 0.06 Source 2.08 2.28 2.00 1.86 2.50 2.22 Ratio 0.04 0.04 0.02 0.03 0.04 0.03
- 115. Results High 1 2 3 4 5 6 Point 0.45 0.14 0.18 0.10 0.10 0.14 Source 2.29 2.25 2.32 2.49 2.43 2.38 Ratio 0.20 0.06 0.08 0.04 0.04 0.06 Low 1 2 3 4 5 6 Point 0.09 0.08 0.04 0.06 0.09 0.06 Source 2.08 2.28 2.00 1.86 2.50 2.22 Ratio 0.04 0.04 0.02 0.03 0.04 0.03
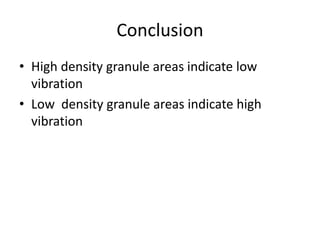
- 116. Conclusion ? High density granule areas indicate low vibration ? Low density granule areas indicate high vibration
- 117. TT-Plot Automation .
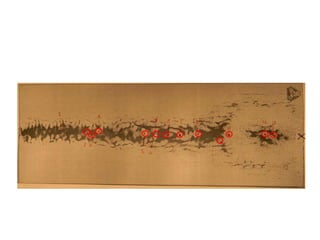
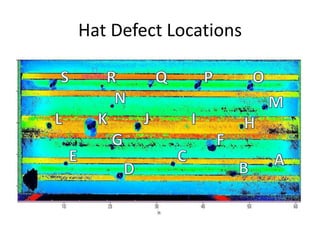
- 118. Hat Defect Locations
- 119. Legend: < 1Ī▒ Diameter, 9 Each 1.0Ī▒ ©C 1.75Ī▒ Diameter, 6 Each 1.75Ī▒ - 2.65Ī▒ Diameter, 4 Each > 2.65Ī▒ Diameter, 3 Each 0.170Ī▒ Skin 0.096Ī▒ Skin Impact Panel for Wayne State University 60Ī▒ 9/30/2011 Final Impact Plan - RJB
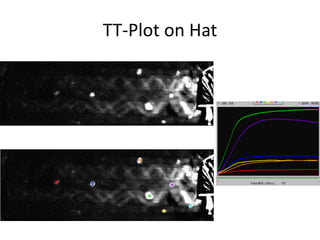
- 120. TT-Plot on Hat
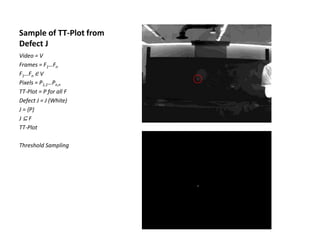
- 121. Sample of TT-Plot from Defect J Video = V Frames = F1ĪŁFn F1ĪŁFn Ī╩ V Pixels = P1,1ĪŁPn,n TT-Plot = P for all F Defect J = J (White) J = {P} J ? F TT-Plot Threshold Sampling
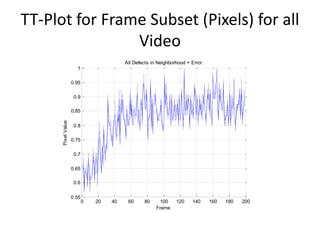
- 122. TT-Plot for Frame Subset (Pixels) for all Video 0 20 40 60 80 100 120 140 160 180 200 1 0.95 0.9 0.85 0.8 0.75 0.7 0.65 0.6 0.55 All Defects in Neighborhood + Error Pixel Value Frame
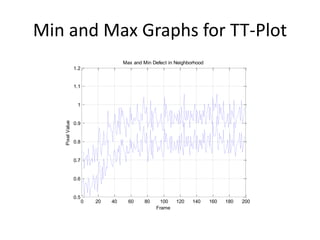
- 123. Min and Max Graphs for TT-Plot 0 20 40 60 80 100 120 140 160 180 200 1.2 1.1 1 0.9 0.8 0.7 0.6 0.5 Max and Min Defect in Neighborhood Pixel Value Frame
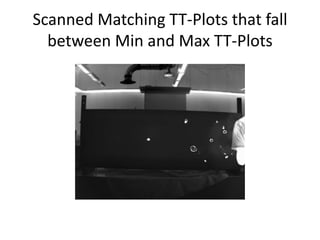
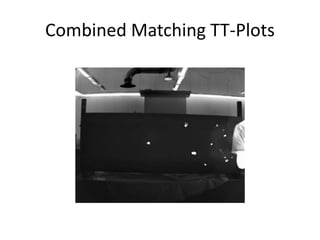
- 124. Scanned Matching TT-Plots that fall between Min and Max TT-Plots
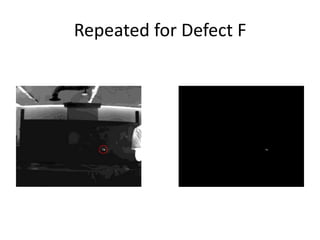
- 125. Repeated for Defect F
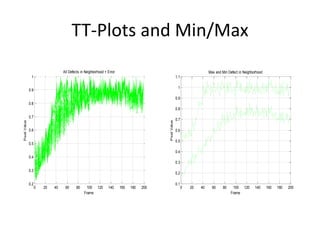
- 126. TT-Plots and Min/Max 0 20 40 60 80 100 120 140 160 180 200 1 0.9 0.8 0.7 0.6 0.5 0.4 0.3 0.2 All Defects in Neighborhood + Error Pixel Value Frame 0 20 40 60 80 100 120 140 160 180 200 1.1 1 0.9 0.8 0.7 0.6 0.5 0.4 0.3 0.2 0.1 Max and Min Defect in Neighborhood Pixel Value Frame
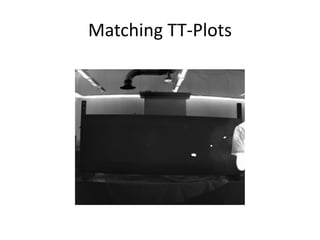
- 127. Matching TT-Plots
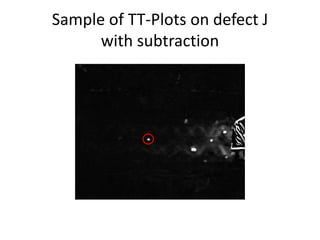
- 129. Sample of TT-Plots on defect J with subtraction
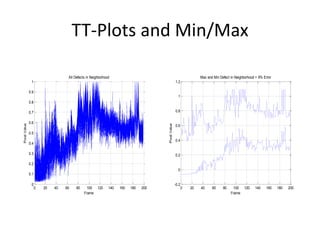
- 130. TT-Plots and Min/Max 0 20 40 60 80 100 120 140 160 180 200 1 0.9 0.8 0.7 0.6 0.5 0.4 0.3 0.2 0.1 0 All Defects in Neighborhood Pixel Value Frame 0 20 40 60 80 100 120 140 160 180 200 1.2 1 0.8 0.6 0.4 0.2 0 -0.2 Max and Min Defect in Neighborhood + 9% Error Pixel Value Frame
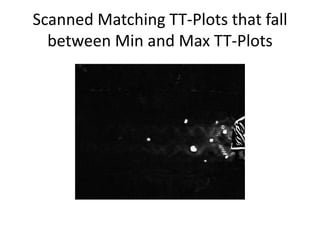
- 131. Scanned Matching TT-Plots that fall between Min and Max TT-Plots
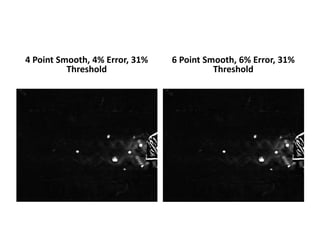
- 132. 4 Point Smooth, 4% Error, 31% Threshold 6 Point Smooth, 6% Error, 31% Threshold
- 133. 4 Point Smooth, 7% Error, 31% Threshold 6 Point Smooth, 7% Error, 31% Threshold
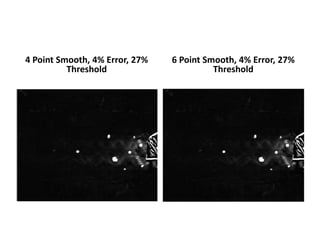
- 134. 4 Point Smooth, 4% Error, 27% Threshold 6 Point Smooth, 4% Error, 27% Threshold
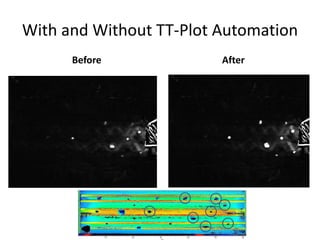
- 135. With and Without TT-Plot Automation Before After
- 136. Conclusion ? Shows possibility of automatic defect detection ? Does not support hypothesis that depth of defect is directly proportional to how slow it shows up on camera
- 137. Final Conclusion ? Behavior of Panels Observed ? Optimal Experimental Settings Tested ©C Frequency ©C Coupling Material ©C Tip Size/Amplitude ? Additional Areas of Study ©C Mode Pattern Vibration ©C Automation
- 138. Future Work ? Further study on mode pattern ? Further study on TT-Plot shape of defects/depth of defects